FIGURE SUMMARY
Title

Allergic Reactions and Immunity in Response to Tick Salivary Biogenic Substances and Red Meat Consumption in the Zebrafish Model

Authors
Contreras, M., Pacheco, I., Alberdi, P., Díaz-Sánchez, S., Artigas-Jerónimo, S., Mateos-Hernández, L., Villar, M., Cabezas-Cruz, A., de la Fuente, J.
Source
Full text @ Front Cell Infect Microbiol

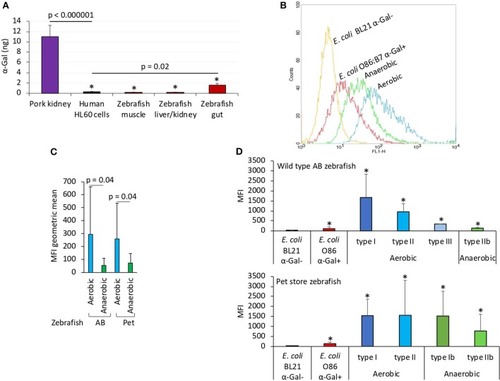
The α-Gal content is similar in humans and zebrafish. The α-Gal content was determined in zebrafish tissues and gut bacterial microbiota and in R. sanguineus salivary glands. (A) The α-Gal levels were determined by ELISA in zebrafish muscle, liver/kidney, and gut and in comparison with pork kidney (α-Gal positive) and human HL60 cells (α-Gal negative) as positive and negative controls, respectively. The results were converted to α-Gal content per sample using a calibration curve (R2 = 0.992; Supplementary Figure 5A) and compared between all samples and negative (lines) or positive (*p < 1E-8) controls by Student t-test with unequal variance (p < 0.05, N = 5 biological replicates). (B) Flow cytometry showing the presence of α-Gal on the surface of aerobic and anaerobic bacteria isolated from zebrafish gut microbiota. Escherichia coli O86:B7 and BL21 (DE3) strains were included as positive and negative controls for α-Gal, respectively. For flow cytometry, cells were stained with Bandeiraea simplicifolia I-isolectin B4–FITC to visualize α-Gal, and the viable cell population was gated according to forward-scatter and side-scatter parameters. (C) The MFI was determined by flow cytometry, and the geometric mean ± SD compared between aerobic and anaerobic bacteria by Student t-test with unequal variance (p = 0.05, N = 5 biological replicates). (D) Distribution of the MFI among aerobic and anaerobic type bacteria in wild-type AB and pet store zebrafish and in comparison with E. coli O86:B7 and BL21 (DE3)–positive and –negative controls for α-Gal, respectively. The results (average ± SD) were compared between all samples and negative control by Student t-test with unequal variance (*p < 0.05, N = 5 biological replicates).

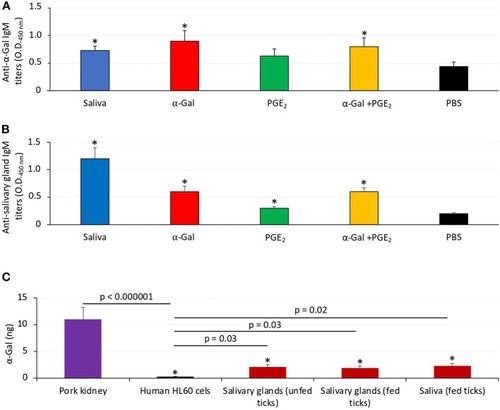
Zebrafish develop antibodies against tick α-Gal and proteins. (A) The IgM antibody titers against α-Gal were determined by ELISA, represented as the average ± SD OD at 450 nm and compared between fish treated with saliva, α-Gal, PGE2, or α-Gal + PGE2, and the PBS-treated control group by Student t-test with unequal variance (*p < 0.005; N = 7–9). (B) The IgM antibody titers against tick salivary gland proteins were determined by ELISA, represented as the average ± SD OD at 450 nm and compared between fish treated with saliva, α-Gal, PGE2, or α-Gal + PGE2 and the PBS-treated control group by Student t-test with unequal variance (*p < 0.001; N = 7–9). (C) The α-Gal levels were determined by ELISA in salivary glands from unfed and partially fed ticks and saliva from fed ticks in comparison with pork kidney (α-Gal positive) and human HL60 cells (α-Gal negative) as positive and negative controls, respectively. The results were converted to α-Gal content per sample using a calibration curve (R2 = 0.992; Supplementary Figure 5A) and compared between all samples and negative (lines) or positive (*p < 1E-8) controls by Student t-test with unequal variance (p < 0.05, N = 3 biological replicates).

Experimental design. Experiments were designed and performed to evaluate the allergic reactions and immune response in zebrafish treated with tick saliva and salivary components and in response to red meat consumption. (A) In Experiment 1, zebrafish were injected with 2.5 μL tick saliva and biogenic substances α-Gal and PGE2 to evaluate the allergic reactions and immune response in fish feeding on fish feed or dog food. Serum and tissue samples were collected to determine anti–α-Gal IgM response, intestine and kidney for qRT-PCR analysis of immune response markers, and half fish for histochemical characterization of local granulocytes. (B) Experiment 2 was conducted to inject fish with less amount of tick saliva than in Experiment 1 (1 μL instead of 2.5 μL R. sanguineus saliva) to reduce response to toxic and anticoagulant biogenic compounds different from α-Gal and PGE2 present in tick saliva and to better monitor the incidence of allergic reactions, abnormal behavior patterns, and feeding during the experiment. Zebrafish local allergic reactions and behavior were examined immediately after treatment or feed change and followed daily until the end of the experiment at day 14 (Experiment 1) or day 10 (Experiment 2). Fish and tick representative images are shown.

Zebrafish injected with tick saliva develop hemorrhagic anaphylactic-type reactions (Experiment 1). (A) Accumulated zebrafish allergy was compared between different groups by a one-way ANOVA test (p < 0.05; N = 7–9 biological replicates). (B) Accumulated zebrafish survival in the different groups was compared by a Cox proportional survival regression test (p < 0.05; N = 7–9 biological replicates). (C) Signs of hemorrhagic anaphylactic-type reactions in zebrafish 29-1 injected with α-Gal + PGE2. Fish No. 29-1 died on day 1. (D) Representative comparison between necropsied control fish No. 30-1 injected with PBS and fish No. 26-1 injected with tick saliva. Evidence of hemorrhage is shown in organs of a saliva-injected fish.

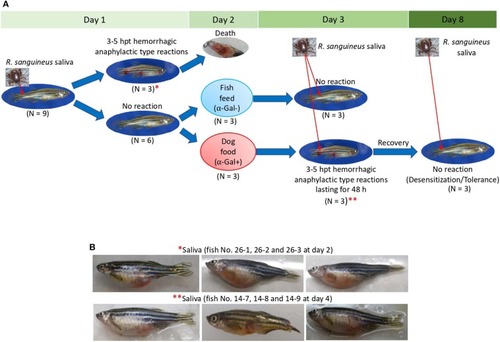
Zebrafish injected with tick saliva and fed with red meat develop hemorrhagic anaphylactic-type reactions and desensitization (Experiment 1). (A) In the zebrafish model, 33% of animals treated with tick saliva on day 1 developed hemorrhagic anaphylactic-type allergic reactions 3–5 hpt and died. Furthermore, 100% of fish fed with dog food, but none of the fish that continued feeding on fish feed at day 2, developed allergy to tick saliva injected on day 3. Once recovered from anaphylactic-type reactions, all fish were desensitized and became tolerant to tick saliva injected on day 8. (B) Signs of hemorrhagic anaphylactic-type reactions in zebrafish No. 26-1, 26-2, and 26-3 injected with tick saliva and dying at day 2 before food change. After food change, only fish No. 14-7, 14-8, and 14-9 feeding on dog food developed anaphylactic-type reactions. Asterisks in red connect representative fish images in (A) with results in (B).

α-Gal levels in dog food and fish feed and correlation analysis between anti–α-Gal IgM antibody levels and allergic reactions to tick saliva. (A) The α-Gal levels were determined by ELISA in fish feed and dog food and in comparison with pork kidney (α-Gal positive) and human HL60 cells (α-Gal negative) as positive and negative controls, respectively. The results were converted to α-Gal content per sample using a calibration curve (R2 = 0.992; Supplementary Figure 5A) and compared between samples and negative control and between dog food and fish feed by Student t-test with unequal variance (p < 0.05, N = 3 biological replicates). The main components of dog food and fish feed are shown. Only dog food contains α-Gal–positive animal-derived products. (B) Spearman ρ correlation analysis between anti–α-Gal IgM antibody levels and allergic reactions to tick saliva in Experiment 1 rated as 10 for fish with allergic reactions and death (AD), 8 for fish with allergic reactions only (A), and 0 for fish without reactions (NR). Correlation rank coefficient (ρ) and p-value are shown.

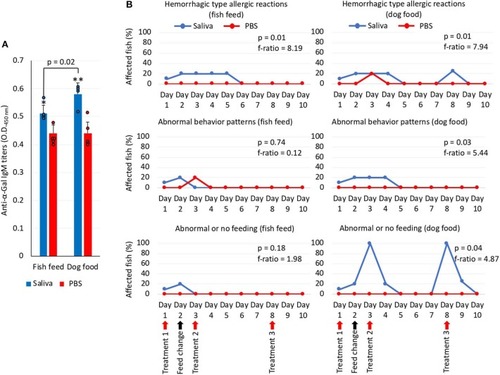
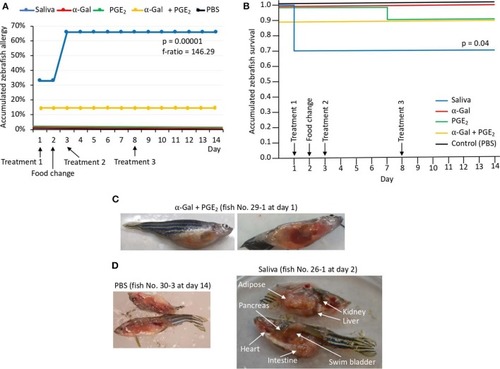
Zebrafish injected with tick saliva and fed with red meat develop allergic reactions and abnormal behavior and feeding patterns (Experiment 2). (A) The IgM antibody titers against α-Gal were determined by ELISA, represented as the average ± SD OD at 450 nm and compared between fish treated with tick saliva and the PBS-treated control group and between fish fed on fish feed or dog food Student t-test (*p = 0.003, **p = 0.0008; N = 4–5 biological replicates with individual values shown). (B) Zebrafish local allergic reactions and behavior were examined immediately after treatment or feed change and followed daily until the end of the experiment at day 10. The percent of zebrafish affected by allergic reactions and abnormal behavior and feeding on each group fed with fish feed or dog food was compared between saliva-treated and PBS-treated control fish by a one-way ANOVA test (https://www.socscistatistics.com/tests/anova/default2.aspx) (p = 0.05; N = 4–5 biological replicates).

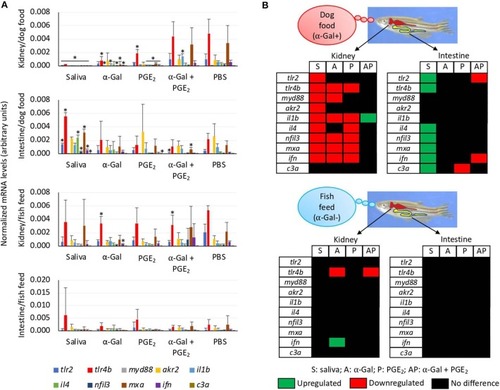
Tissue-specific differences in the immune response of zebrafish injected with tick saliva and fed with red meat (Experiment 1). (A) The expression of selected immune response and food allergy markers was analyzed by qRT-PCR in the kidney and intestine of zebrafish fed on dog food or fish feed. The mRNA Ct values were normalized against D. rerio gapdh, presented as average ± SD, and compared between fish treated with saliva, α-Gal, PGE2, or α-Gal + PGE2, and the PBS-treated control group by Student t-test with unequal variance (*p < 0.05; N = 3–6). (B) Representation of differential gene expression with respect to PBS-treated controls in the kidney and intestine of zebrafish fed on dog food or fish feed. Data were obtained from the analysis described in (A).

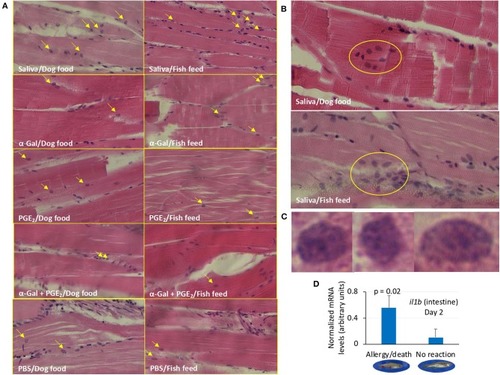
Granulocyte profile in zebrafish (Experiment 1). (A) Representative images of granulocytes detected in tissue sections stained with hematoxylin and eosin of zebrafish treated with saliva, α-Gal, PGE2, or α-Gal + PGE2, or the PBS control and fed with dog food or fish feed. The fields were randomly chosen, and granulocytes are indicated with arrows. The average counts of granulocytes were compared between fish treated with tick saliva, α-Gal, or PGE2 α-Gal + PGE2, and PBS-treated controls and between fish fed on dog food or fish feed for each treatment by Student t-test with unequal variance (p < 0.05; N = 3–6; Supplementary Figure 4). Most granulocytes were observed in the skeletal muscle. Magnification ×40. (B) Representative images of granulocytes agglomerations only detected in zebrafish treated with tick saliva. Magnification ×40. (C) Selected images for identified granulocytes showing characteristics of basophils/eosinophils. Magnification ×100. (D) The expression of selected immune response and food allergy markers was analyzed by qRT-PCR in the kidney and intestine of zebrafish treated with saliva and presenting anaphylactic-type reactions and death on day 2, and fish without reactions and normalized mRNA Ct values (average ± SD) were compared by Student t-test with unequal variance (p < 0.05; N = 3–6). Only il1b gene in the intestine showed significant differences.

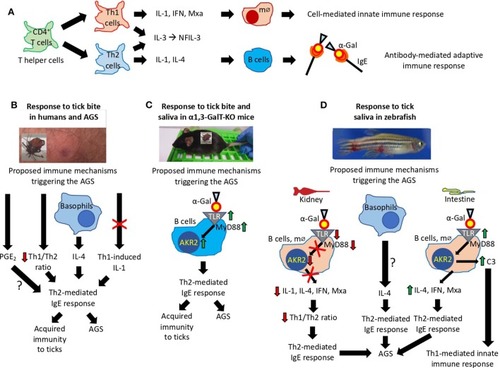
Proposed mechanisms triggering the AGS. (A) Mechanisms mediated by CD4+ T cells or T helper (TH) cells that develop into TH1 and TH2 cells regulating cell-mediated and antibody-mediated innate and adaptive immune responses, respectively. (B–D) Immune mechanisms triggering the AGS that have been proposed based on existing evidence in (B) humans, (C) α1,3-GalT-KO mice, and (D) our zebrafish animal model. The interrogation marks (?) represent mechanisms that need additional evidence to be sustained.

Acknowledgments
This image is the copyrighted work of the attributed author or publisher, and ZFIN has permission only to display this image to its users. Additional permissions should be obtained from the applicable author or publisher of the image. Full text @ Front Cell Infect Microbiol