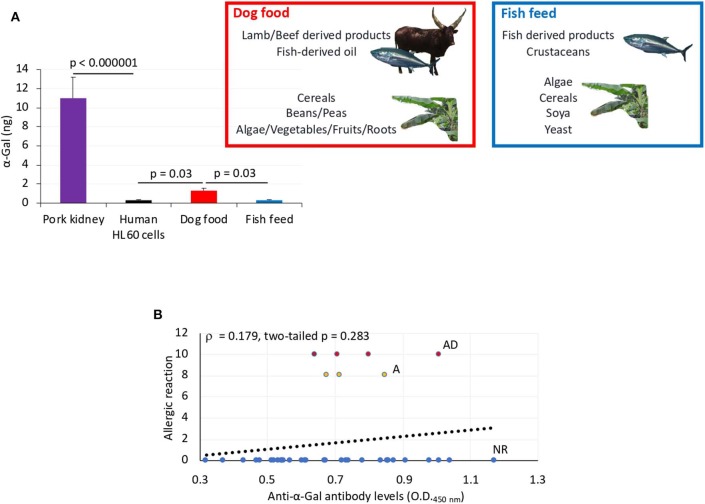
IMAGE

Figure 6

ID
ZDB-IMAGE-200406-171
Source
Figures for Contreras et al., 2020
Image
Figure Caption

Figure 6

α-Gal levels in dog food and fish feed and correlation analysis between anti–α-Gal IgM antibody levels and allergic reactions to tick saliva. (A) The α-Gal levels were determined by ELISA in fish feed and dog food and in comparison with pork kidney (α-Gal positive) and human HL60 cells (α-Gal negative) as positive and negative controls, respectively. The results were converted to α-Gal content per sample using a calibration curve (R2 = 0.992; Supplementary Figure 5A) and compared between samples and negative control and between dog food and fish feed by Student t-test with unequal variance (p < 0.05, N = 3 biological replicates). The main components of dog food and fish feed are shown. Only dog food contains α-Gal–positive animal-derived products. (B) Spearman ρ correlation analysis between anti–α-Gal IgM antibody levels and allergic reactions to tick saliva in Experiment 1 rated as 10 for fish with allergic reactions and death (AD), 8 for fish with allergic reactions only (A), and 0 for fish without reactions (NR). Correlation rank coefficient (ρ) and p-value are shown.

Acknowledgments
This image is the copyrighted work of the attributed author or publisher, and ZFIN has permission only to display this image to its users. Additional permissions should be obtained from the applicable author or publisher of the image. Full text @ Front Cell Infect Microbiol