IMAGE

Figure 9

ID
ZDB-IMAGE-200406-174
Source
Figures for Contreras et al., 2020
Image
Figure Caption

Figure 9

Granulocyte profile in zebrafish (Experiment 1).
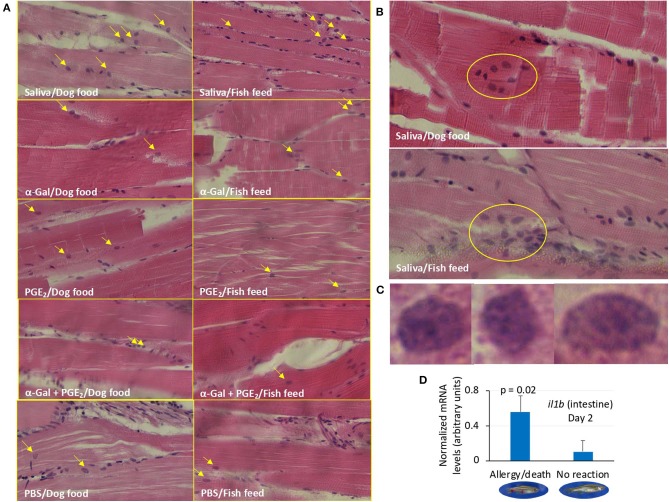
 (A) Representative images of granulocytes detected in tissue sections stained with hematoxylin and eosin of zebrafish treated with saliva, α-Gal, PGE2, or α-Gal + PGE2, or the PBS control and fed with dog food or fish feed. The fields were randomly chosen, and granulocytes are indicated with arrows. The average counts of granulocytes were compared between fish treated with tick saliva, α-Gal, or PGE2 α-Gal + PGE2, and PBS-treated controls and between fish fed on dog food or fish feed for each treatment by Student t-test with unequal variance (p < 0.05; N = 3–6; Supplementary Figure 4). Most granulocytes were observed in the skeletal muscle. Magnification ×40. (B) Representative images of granulocytes agglomerations only detected in zebrafish treated with tick saliva. Magnification ×40. (C) Selected images for identified granulocytes showing characteristics of basophils/eosinophils. Magnification ×100. (D) The expression of selected immune response and food allergy markers was analyzed by qRT-PCR in the kidney and intestine of zebrafish treated with saliva and presenting anaphylactic-type reactions and death on day 2, and fish without reactions and normalized mRNA Ct values (average ± SD) were compared by Student t-test with unequal variance (p < 0.05; N = 3–6). Only il1b gene in the intestine showed significant differences.

Acknowledgments
This image is the copyrighted work of the attributed author or publisher, and ZFIN has permission only to display this image to its users. Additional permissions should be obtained from the applicable author or publisher of the image. Full text @ Front Cell Infect Microbiol