IMAGE

Figure 8

ID
ZDB-IMAGE-200406-173
Source
Figures for Contreras et al., 2020
Image
Figure Caption

Figure 8

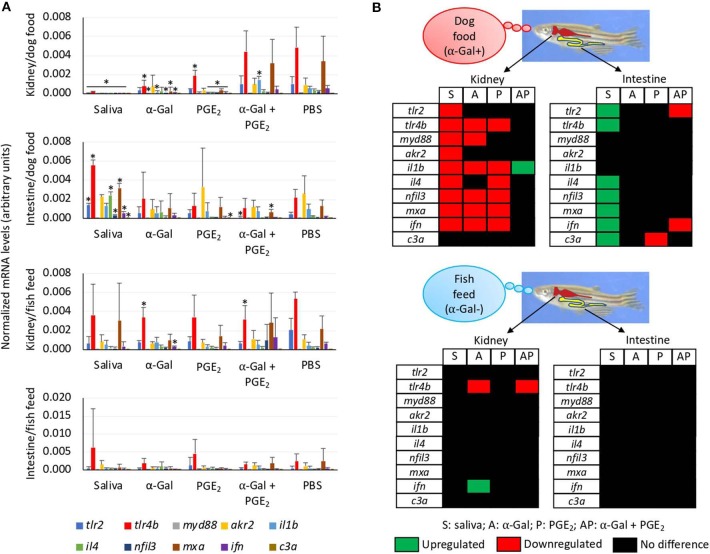
Tissue-specific differences in the immune response of zebrafish injected with tick saliva and fed with red meat (Experiment 1). (A) The expression of selected immune response and food allergy markers was analyzed by qRT-PCR in the kidney and intestine of zebrafish fed on dog food or fish feed. The mRNA Ct values were normalized against D. rerio gapdh, presented as average ± SD, and compared between fish treated with saliva, α-Gal, PGE2, or α-Gal + PGE2, and the PBS-treated control group by Student t-test with unequal variance (*p < 0.05; N = 3–6). (B) Representation of differential gene expression with respect to PBS-treated controls in the kidney and intestine of zebrafish fed on dog food or fish feed. Data were obtained from the analysis described in (A).

Acknowledgments
This image is the copyrighted work of the attributed author or publisher, and ZFIN has permission only to display this image to its users. Additional permissions should be obtained from the applicable author or publisher of the image. Full text @ Front Cell Infect Microbiol