IMAGE

Figure 2

ID
ZDB-IMAGE-200406-167
Source
Figures for Contreras et al., 2020
Image
Figure Caption

Figure 2

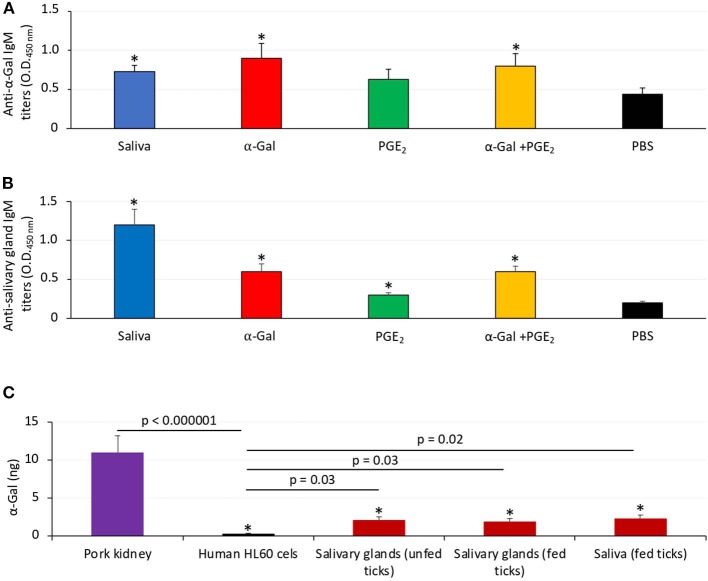
Zebrafish develop antibodies against tick α-Gal and proteins. (A) The IgM antibody titers against α-Gal were determined by ELISA, represented as the average ± SD OD at 450 nm and compared between fish treated with saliva, α-Gal, PGE2, or α-Gal + PGE2, and the PBS-treated control group by Student t-test with unequal variance (*p < 0.005; N = 7–9). (B) The IgM antibody titers against tick salivary gland proteins were determined by ELISA, represented as the average ± SD OD at 450 nm and compared between fish treated with saliva, α-Gal, PGE2, or α-Gal + PGE2 and the PBS-treated control group by Student t-test with unequal variance (*p < 0.001; N = 7–9). (C) The α-Gal levels were determined by ELISA in salivary glands from unfed and partially fed ticks and saliva from fed ticks in comparison with pork kidney (α-Gal positive) and human HL60 cells (α-Gal negative) as positive and negative controls, respectively. The results were converted to α-Gal content per sample using a calibration curve (R2 = 0.992; Supplementary Figure 5A) and compared between all samples and negative (lines) or positive (*p < 1E-8) controls by Student t-test with unequal variance (p < 0.05, N = 3 biological replicates).

Acknowledgments
This image is the copyrighted work of the attributed author or publisher, and ZFIN has permission only to display this image to its users. Additional permissions should be obtained from the applicable author or publisher of the image. Full text @ Front Cell Infect Microbiol