
- Title
-
Bioinspired Molecular Factories with Architecture and In Vivo Functionalities as Cell Mimics
- Authors
- Einfalt, T., Garni, M., Witzigmann, D., Sieber, S., Baltisberger, N., Huwyler, J., Meier, W., Palivan, C.G.
- Source
- Full text @ Adv Sci (Weinh)
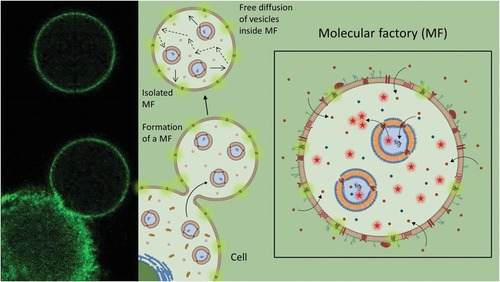
Strategy for creating bioinspired molecular factories. To create a molecular factory (MF) we start by internalizing artificial cargoes (specific molecules and preformed artificial organelles based on polymersomes loaded with active compounds) in the donor mammalian cell. The membrane of the donor cell can also be modified to contain proteins or receptors of interest. Once loaded with all the necessary components of the MF, a transfer of material from the donor cell cytoplasm and membrane is achieved during vesicle formation. After isolation, the MFs are completely independent of the donor cells. |

Transfer of cytosolic components from the cellular cytosol into E‐GPMVs. A) Left column: Top) Schematic representation of HepG2 cells with enhanced membrane and cytosolic content. Central) Illustration of the formation of equipped‐GPMV (E‐GPMV) from the donor cells. Bottom) Isolated E‐GPMV. Middle column: Top) CLSM micrograph of HepG2 cells containing Chol‐PEG5000‐FITC copolymer in the membrane (Green), Scale bar = 15 µm. Central) CLSM micrograph of E‐GPMVs formation by several cells, Scale bar = 40 µm; Chol‐PEG5000‐FITC copolymer is inserted both in the cells and in the GPMVs membrane. Bottom) CLSM micrograph with a zoom of one isolated E‐GPMV containing Chol‐PEG5000‐FITC copolymer in the membrane (Scale bar = 10 µm). Right column: Top) CLSM micrograph of HepG2 cells simultaneously containing Actin‐RFP protein (Red) and the membrane protein Lck‐GFP (Green), Scale bar = 15 µm. Central) CLSM micrograph of E‐GPMVs formation by several cells, Scale bar = 40 µm; Actin‐RFP protein (Red) and the membrane protein Lck‐GFP (Green) are located both in the cells and in the GPMVs. Bottom) CLSM micrograph with a zoom of one isolated E‐GPMV containing Actin‐RFP protein (Red) and the membrane protein Lck‐GFP (Green), Scale bar 10 µm. CLSM Controls are available in the Supporting Information. B) Flow Cytometry analysis of E‐GPMVs, size characterization by sideward and forward scattering analysis. The ellipse represents E‐GPMV populations (2.0–9.9 µm) used for analysis by flow cytometry. Blue to red color‐coded polystyrene particles in sizes from 2.0, 3.4, 5.11, 7.6, 9.9, and 14.3 µm. Green: E‐GPMV population. C) Size distribution of the E‐GPMVs with membranes supplemented with the membrane protein Lck‐GFP obtained by analysis of CLSM micrographs. N = 501 individual E‐GPMVs. D) Flow cytometry analysis of E‐GPMVs equipped with Chol‐PEG5000‐FITC copolymer (Green) and control (unmodified) GPMVs (Gray). E) Flow cytometry analysis of Annexin V‐Atto488 binding to E‐GPMVs equipped with the copolymer Chol‐PEG5000: Control GPMVs without Annexin V (Red), control GPMVs with added Annexin V (Green) and E‐GPMVs equipped with Chol‐PEG5000 copolymer and added Annexin V (Orange). F) Size distribution of E‐GPMVs equipped with Chol‐PEG5000‐FITC copolymer obtained by analysis of CLSM micrographs. |

Transfer of cytosolic components from the cellular cytosol into E‐GPMVs. A) Left column: Top) Schematic representation of HepG2 cells with enhanced membrane and cytosolic content. Central) Illustration of the formation of several equipped‐GPMV with multicompartment structure (E‐GPMV) from the donor cells. Bottom) One isolated E‐GPMV with microcompartment structure. Right column: Top) CLSM micrograph of HepG2 cells containing membrane protein LcK‐GFP (Green) and SRB‐loaded PMOXA6‐PDMS44‐PMOXA6 polymersomes (Red), Scale bar 20 µm. Central) CLSM micrograph of several E‐GPMV, Scale bar 7 µm. Bottom) CLSM micrograph of one isolated E‐GPMV simultaneously containing Lck‐GFP protein and SRB‐loaded PMOXA6‐PDMS44‐PMOXA6 polymersomes, Scale bar 5 µm. See Movies S3–S8 in the Supporting Information. CLSM Controls are available in the Supporting Information. B) Cryogenic transmission electron micrograph of PMOXA6‐PDMS44‐PMOXA6 polymersomes in PBS pH 7.4. Scale bar represents 200 nm (left) and 50 nm (right). C) FCS analysis of SRB‐loaded PMOXA6‐PDMS44‐PMOXA6 polymersomes in PBS pH 7.4 (Blue) and SRB‐loaded PMOXA6‐PDMS44‐PMOXA6 polymersomes within E‐GPMVs (Red), Free SRB at pH 7.4 PBS (Black). Arrowhead indicates the change in diffusion time from free SRB polymersomes once they are encapsulated in E‐GPMVs. Dotted line—experimental auto correlation curves, full line—fit. Curves normalized to 1 to facilitate comparison. D) Frequency distribution of diffusion times taken from individual FCS measurements: SRB‐loaded PMOXA6‐PDMS44‐PMOXA6 polymersomes in PBS pH 7.4 (Blue) and SRB‐loaded PMOXA6‐PDMS44‐PMOXA6 polymersomes within E‐GPMVs (Red) ( |
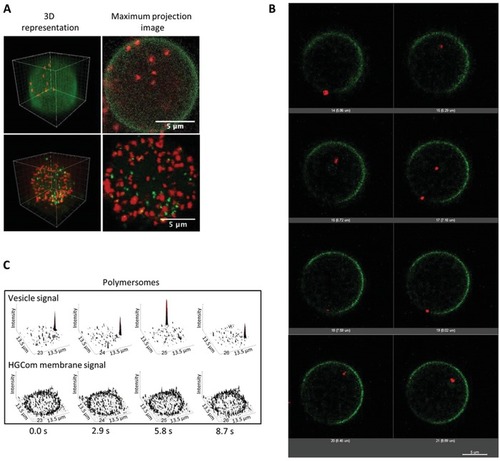
Subcompartmentalization within E‐GPMVs. A) 3D reconstructions (left) and maximum intensity projection images of Z stacks (right) of E‐GPMVs with multicompartment architecture. Top: SRB‐loaded polymersomes inside E‐GPMVs equipped with Lck‐GFP. Red: signal of SRB‐loaded polymersomes. Green: signal of Lck‐GFP membrane protein. Bottom: SRB‐loaded polymersomes and CF‐loaded polymersomes inside E‐GPMVs. Red: signal of SRB encapsulated inside polymersomes. Green: signal of CF encapsulated inside polymersomes. B) Single plane projections of different Z positions during E‐GPMV Z‐stacking process by CLSM. Z interval = 1 µm. Red: SRB loaded polymersomes. Green: Lck‐GFP membrane protein. C) Single plane recordings of PMOXA6‐PDMS44‐PMOXA6 polymersomes inside E‐GPMVs measured by CLSM. See Movies S3–S8 in the Supporting Information. |
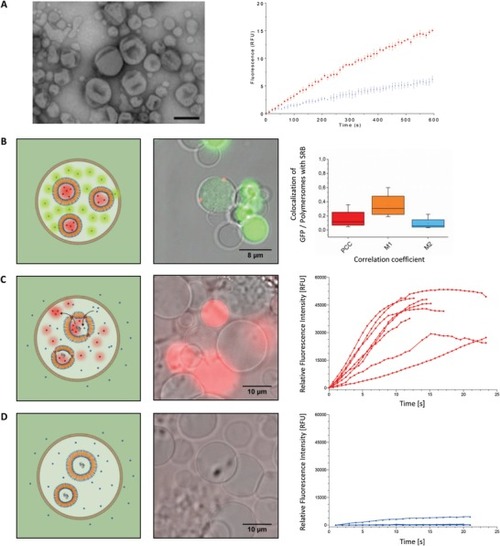
Engineering a MF. A) Left: TEM micrograph of AOs based on PMOXA6‐PDMS44‐PMOXA6 polymersomes loaded with horseradish peroxidase (HRP) and equipped with OmpF. Scale bar: 500 nm. Right: Amplex UltraRed conversion kinetics of AOs equipped with OmpF (red) and AOs without OmpF (blue). Standard deviations are based on 3 individual measurements. B) Spatial colocalization in E‐GPMVs. Left: Schematic representation of E‐GPMVs containing SRB‐loaded polymersomes and cytosolic GFP protein. Middle: CLSM micrograph of E‐GPMVs containing SRB‐loaded polymersomes (Red signal) and cytosolic GFP protein (Green signal). Right: Colocalization analysis of SRB‐loaded polymersomes and GFP protein within E‐GPMVs. PCC = 0.16 ± 0.14, M1 = 0.35 ± 0.1, M2 = 0.09 ± 0.09. |

MF functionality in vivo. A) Schematic representation of ZFE injection and imaging. Green: ZFE vasculature. B) RFP‐loaded, Chol‐PEG500 enhanced MFs in ZFE circulation. Red: RFP in MF cavity. C) RFP‐loaded Chol‐PEG5000‐MFs (Red) deposited on ZFE vasculature (Green). D) Decay in fluorescence intensity of individual MFs, in ZFE during photo bleaching. Red: RFP signal. Black: Melanocyte signal. E1) CLSM micrograph before photo bleaching. E2) CLSM micrograph after photo bleaching. F) CLSM micrographs of CTDR and Chol‐PEG5000‐FITC MFs deposited in ZFE vasculature. Blue: CTRD signal, Green: Chol‐PEG5000‐FITC signal. See Movies S11–S14 in the Supporting Information. G) In vivo functionality of MFs in ZFE. Red: Resorufin‐like product signal. Green: Chol‐PEG5000‐FITC signal. H) Production of resorufin‐like product by MFs in ZFE. Relative fluorescence intensity increase within an individual MF (single confocal plane) as compared to background fluorescence. Control: Individual MF containing AOs with no OmpF. |