
|
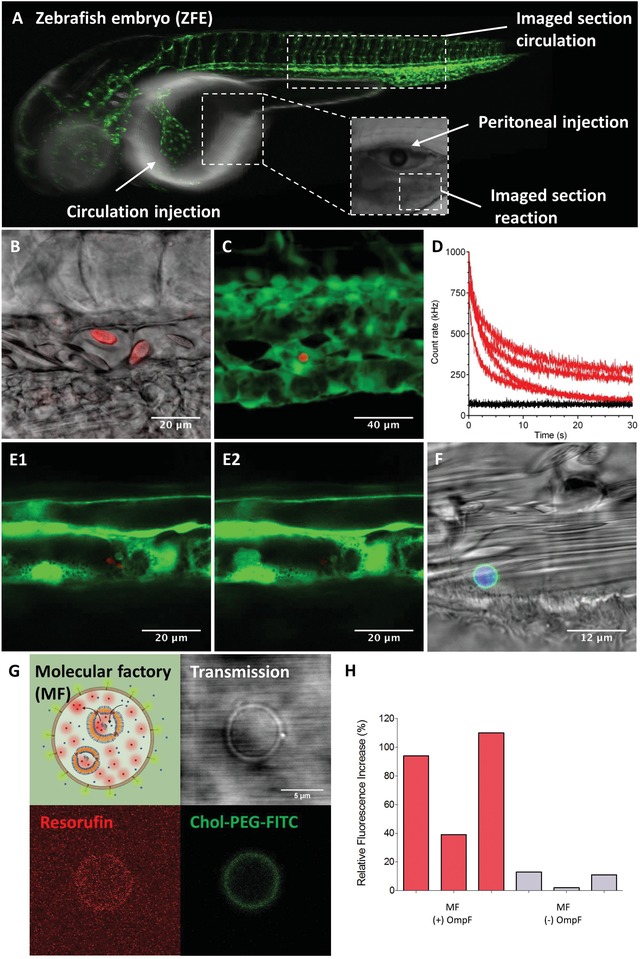
Figure 6
MF functionality in vivo. A) Schematic representation of ZFE injection and imaging. Green: ZFE vasculature. B) RFP‐loaded, Chol‐PEG500 enhanced MFs in ZFE circulation. Red: RFP in MF cavity. C) RFP‐loaded Chol‐PEG5000‐MFs (Red) deposited on ZFE vasculature (Green). D) Decay in fluorescence intensity of individual MFs, in ZFE during photo bleaching. Red: RFP signal. Black: Melanocyte signal. E1) CLSM micrograph before photo bleaching. E2) CLSM micrograph after photo bleaching. F) CLSM micrographs of CTDR and Chol‐PEG5000‐FITC MFs deposited in ZFE vasculature. Blue: CTRD signal, Green: Chol‐PEG5000‐FITC signal. See Movies S11–S14 in the Supporting Information. G) In vivo functionality of MFs in ZFE. Red: Resorufin‐like product signal. Green: Chol‐PEG5000‐FITC signal. H) Production of resorufin‐like product by MFs in ZFE. Relative fluorescence intensity increase within an individual MF (single confocal plane) as compared to background fluorescence. Control: Individual MF containing AOs with no OmpF.