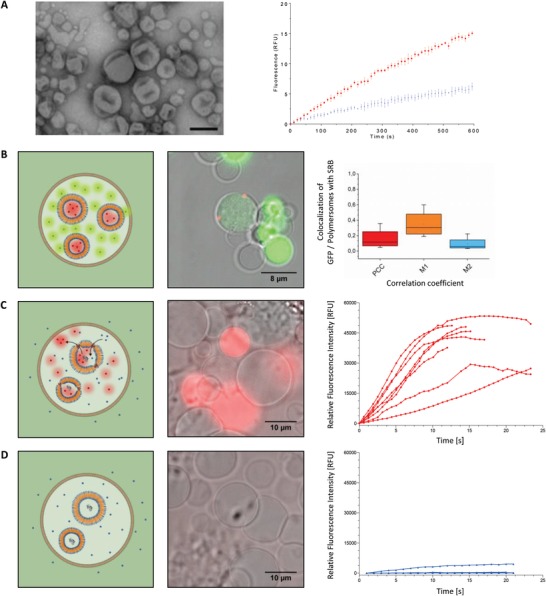
IMAGE

Figure 5

ID
ZDB-IMAGE-200228-6
Source
Figures for Einfalt et al., 2020
Image
Figure Caption

Figure 5

Engineering a MF. A) Left: TEM micrograph of AOs based on PMOXA6‐PDMS44‐PMOXA6 polymersomes loaded with horseradish peroxidase (HRP) and equipped with OmpF. Scale bar: 500 nm. Right: Amplex UltraRed conversion kinetics of AOs equipped with OmpF (red) and AOs without OmpF (blue). Standard deviations are based on 3 individual measurements. B) Spatial colocalization in E‐GPMVs. Left: Schematic representation of E‐GPMVs containing SRB‐loaded polymersomes and cytosolic GFP protein. Middle: CLSM micrograph of E‐GPMVs containing SRB‐loaded polymersomes (Red signal) and cytosolic GFP protein (Green signal). Right: Colocalization analysis of SRB‐loaded polymersomes and GFP protein within E‐GPMVs. PCC = 0.16 ± 0.14, M1 = 0.35 ± 0.1, M2 = 0.09 ± 0.09. n = 5 independent CLSM images. C) Functional MFs containing AOs, which convert in situ Amplex UltraRed into resorufin‐like product. Left: Schematic representation of MFs containing AOs. Middle: CLSM micrograph of real‐time production of the resorufin‐like product by AOs inside MFs (Red signal). Right: Relative fluorescence intensity recordings of individual MFs equipped with AOs. See Movie S9, Panel (D) in the Supporting Information) Control MFs equipped with AOs with no OmpF. Left: Schematic representation of E‐GPMVs containing AOs without OmpF. Middle: CLSM Micrograph demonstrating the absence of conversion of Amplex UltraRed into the resorufin‐like product when AOs inside MFs have no OmpF. Right: Relative fluorescence intensity recordings of individual MFs loaded with AOs without OmpF; See Movie S10 in the Supporting Information.

Acknowledgments
This image is the copyrighted work of the attributed author or publisher, and ZFIN has permission only to display this image to its users. Additional permissions should be obtained from the applicable author or publisher of the image. Full text @ Adv Sci (Weinh)