FIGURE SUMMARY
Title

Dstyk mutation leads to congenital scoliosis-like vertebral malformations in zebrafish via dysregulated mTORC1/TFEB pathway

Authors
Sun, X., Zhou, Y., Zhang, R., Wang, Z., Xu, M., Zhang, D., Huang, J., Luo, F., Li, F., Ni, Z., Zhou, S., Chen, H., Chen, S., Chen, L., Du, X., Chen, B., Huang, H., Liu, P., Yin, L., Qiu, J., Chen, D., Deng, C., Xie, Y., Luo, L., Chen, L.
Source
Full text @ Nat. Commun.

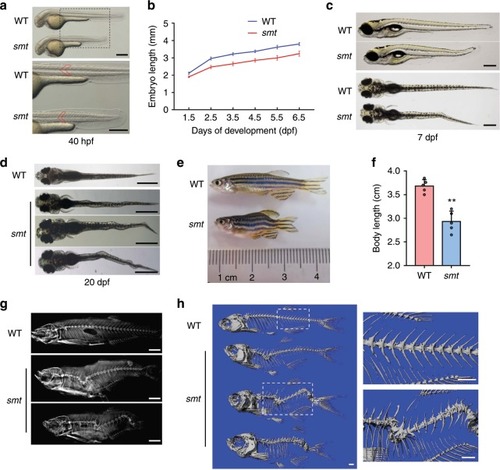
<italic>Smt</italic> mutation leads to CS-like vertebral malformations.

a Bright-field images showing shortened somites and body length in smt mutant at 40 hpf. The bottom panel showed enlarged parts. Red line marks single somites. b Graph depicting the body length measurements of WT (blue line) and smt mutant (red line) from 1.5 dpf to 6.5 dpf, n = 20 independent embryos for WT and smt mutant. Data points represent average body length and error bars represent standard deviation. c Lateral (top) and dorsal views (bottom) showed slight wavy bending in smt mutant at 7 dpf. d At about 20 dpf, smt mutant showed different degrees of curve severity in dorsal view: mild (top), moderate (middle) and severe (bottom) curvature. e Whole mount image of 3-month-old smt mutant (bottom) and WT (top). Smt mutants had scoliosis and quantification of the body length were much shorter than WT (f), n = 5 independent zebrafishes for WT and smt mutant. ** p < 0.01. p values were determined by unpaired two-tailed Student’s t-test. X-rays (g) and three-dimensional micro-CT (h) revealed severe scoliosis and kyphosis in smt mutant (bottom). Boxed regions are magnified in the right panel in (h). Data are presented as mean ± SD. Scale bar represent 200 μm in (a), 400 μm in (c), 1 mm in (d and h), 2 mm in (d). Source data are provided as a Source Data file.

<italic>Smt</italic> mutants encode alleles of <italic>dstyk</italic>.

a Genetic map of the candidate region on chromosome 22 (LG 22). Number of recombinants are depicted in red, and SSLP markers used for mapping are in black. b Sequencing of cDNA revealed that smt mutants had a 24 bp deletion at the end of exon 5 in dstyk coding sequence. c Genomic DNA sequencing revealed smt mutants had a dstyk G → A transversion in the first base of intron 5. Heterozygous smt is presented as hets. An alternative splice site is show in exon 5. d The mutation region of dstyk is evolutionally conserved across different species. Dotted box represents mutated amino acid. e PCR amplified the splicing mutation region (764 bp) of dstyk coding sequence showed more than three splicing types both in mutant pool and mutant individual. Arrows on the left indicate three different splicing types from agarose gel electrophoresis. f Diagramed DSTYK proteins structures of WT and three different predicted mutant proteins. WT DSTYK is comprised of two non-catalytic regions (NCR) and a eukaryotic protein kinase catalytic domain (ePK). Source data are provided as a Source Data file.

Expression pattern of <italic>dstyk</italic> and knock out <italic>dstyk</italic> by CRISPR/Cas9.

aDstyk ISH at 1-cell/2-cell, 4-somite and 8-somite stage. b From 18-somite, 24 hpf, 38 hpf to 54 hpf, notochordal expression of dstyk was dynamically changed as detected by ISH. c The Cas9 target site for knockout dstyk gene worked in knock out F0 generation. d Top panel showed the DNA sequences for WT and two Cas9 mutant lines. TGG (red) is the PAM sequence. Deletion is represented by a red dashed line and insertion is highlighted in green. Bottom panel diagramed DSTYK protein structures of WT and predicted mutants. Arrows indicate amino acid at the mutation site. e Bright-field images showing the WT and two Cas9 mutant lines at 4 dpf. f Cas9 mutant lines showed similar scoliosis phenotypes with smt mutant. Scale bar represent 200 μm in (a and b), 400 μm in (e).

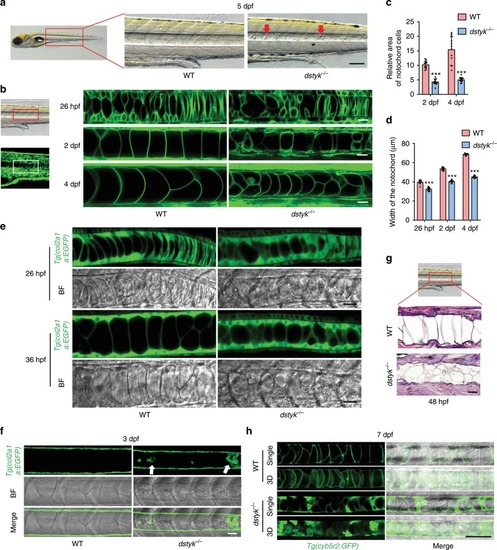
The phenotype of <italic>dstyk</italic> mutants in the notochord.

a Bright-field images showing the WT and dstyk mutant at 5 dpf. Red arrow indicates the small granular structure accumulated in the notochord. b Live confocal images showing the notochord development of WT and dstyk mutant in Tg(β-actin:ras-GFP) transgenic background from 26 hpf to 4 dpf. All cell membranes were labeled by EGFP. c Quantification of relative area of single notochord cell for WT and dstyk mutant at 2 dpf and 4 dpf. n = 10 independent embryos for WT and dstyk mutant, 10 notochord cells were counted for each embryo. d Quantification of width of the notochord for WT and dstyk mutant from 26 hpf to 4 dpf. n = 12 independent embryos for WT and dstyk mutant. ***p < 0.001. p values were determined by unpaired two-tailed Student’s t-test. e Live confocal time-lapse images showing notochord development of WT and dstyk mutant in Tg(col2a1a:EGFP) transgenic background (left) and bright-field (right) at 26 hpf and 36 hpf. f Live confocal images of WT and dstyk mutant in Tg(col2a1a:EGFP) transgenic background at 3 dpf. White arrow indicates ectopic Col2a1a positive cells in the notochord in the mutants. g Hematoxylin and eosin staining of longitudinal sections of the notochord in WT and dstyk mutant at 48 hpf. h Confocal images showing the notochord of WT and dstyk mutants in Tg(cyb5r2:GFP) transgenic background at 7 dpf. All notochord cells were labeled by EGFP. Data are presented as mean ± SD. Scale bar represent 20 μm in (b, e, f and g), 100 μm in (a and h). Source data are provided as a Source Data file.

<italic>Dstyk</italic> gene mutation leads to abnormal vesicle trafficking and dysregulated notochord vacuoles biogenesis.

a Live confocal images of notochord for WT and dstyk mutant in bright-field and staining with MED at 36 hpf (top) and 4 dpf (bottom). b Live confocal images of notochord for WT and dstyk mutant dyed with Golgi tracker BODIPY TR Ceramide and LysoTracker Green at 7 dpf. Note that every notochord cell in the mutant was composed of one LysoTracker Green labeled vacuole (green) and at least one round cystic structure (white arrows) that can be labeled by Golgi tracker. c Confocal images of immunofluorescent staining of WT and dstyk mutants for Rab7a at 36 hpf in the background of Tg(β-actin:ras-GFP). d ISH of shh at 28 hpf (left) and 36 hpf (right) of WT and dstyk mutants. Magnified images in the bottom column. e ISH of cmn at 28 hpf of WT and dstyk mutants. fh ISH of col8a1a (f), col9a1b (g) and col11a2 (h) at 36 hpf of WT and dstyk mutants. Magnified images in the bottom column. Scale bar represent 50 μm in (ac), 200 μm in (dh).

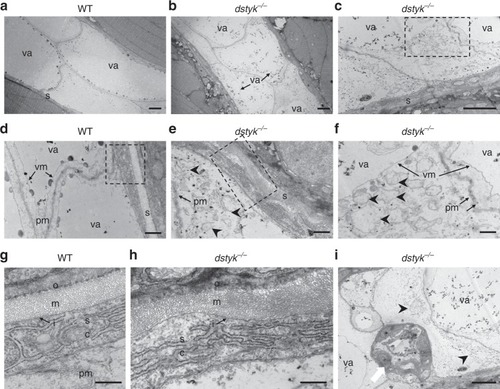
Ultrastructure of the notochord and notochord sheath in WT and <italic>dstyk</italic> mutant.

af The transmission electron micrographs of the notochord in WT (a, d) and dstyk mutant (b, c, e and f) at 48 hpf. Note that the vacuoles were smaller in the dstyk mutant, and there were many scatteredly distributed small vesicles that were wrapped by single layer membrane in the cytoplasm of dstyk mutant. g, h The ultrastructure of the notochord sheath in the WT (g) and dstyk mutant (h). Note the straight, well-organized sheath layer in the WT and wavy, disordered organization of the medial layer in the dstyk mutant. i Ultrastructure of the notochord showed not well vacuolated epithelia-like cells (white arrow) aggregated in dstyk mutant. f, g and h were magnified image of the dotted boxes in c, d and e, respectively. Black arrowheads indicate many small vesicles in the mutant cytoplasm. All images are shown longitudinal sections. The scale bars represent (ac, and i) 5 µm, (df) 1 µm and (g, h) 500 nm. va, vacuole; s, notochord sheath; sc, sheath cell; pm, plasma membrane; vm, vacuole membrane; i, inner laminin-rich layer, m, medial layer, and o, outer collagen-rich layers of the notochord sheath.

<italic>Dstyk</italic> regulates axial skeleton segmentation and spine formation.

a Confocal images showing the notochord sheath cells of WT (left) and dstyk mutants (right) in Tg(col2a1a:EGFP) transgenic background from 7 to 15 dpf. Top three panel show the 3D view and bottom panel shows the single layer. The blue brackets indicate col2a1a positive domains. b Live images of Calcein staining for WT (left) and dstyk mutants (right) from 9 to 20 dpf. Boxed regions at about 20 dpf are magnified in the bottom panel. Note that wedge-shaped and mineralization defect vertebrae (white arrows) were shown in dstyk mutants. c, d Confocal images showing Calcein blue staining of Tg(col2a1a:EGFP);Tg(osterix:mCherry) double transgenic fish of WT and dstyk mutants at 20–25 dpf (c) and at 30–40 dpf (d). Note the disordered notochord sheath segmentation and curvature of the spine. e Lateral (middle) and dorsal view (bottom) of vertebral structure stained with Alizarin red for dstyk mutant zebrafish at about 1 month of age. WT (top) is shown the lateral view. Boxed regions are magnified in the right panel. f Graph depicting the counted number of vertebrae of WT (n = 15 independent embryos) and dstyk mutants (n = 25 independent embryos), *p < 0.05. p values were determined by unpaired two-tailed Student’s t-test. g Confocal images show the notochord cell of WT and dstyk mutants in Tg(cyb5r2:GFP) transgenic background and in vivo skeletal staining of centra with Alizarin red at 20–25 dpf. Left panel shows the single layer and right panel shows the 3D view. White arrows show the severe vacuole biogenesis defect. Black arrowheads show somite boundaries in mutants were not as sharp and straight as those in WT. Data are presented as mean ± SD. Scale bar represent 100 μm in (a, c, d and g), 200 μm in (b). Source data are provided as a Source Data file.

DSTYK is involved in lysosome biogenesis.

a Representative images of immunofluorescent staining for endogenous DSTYK (left) and transfected with exogenous DSTYK-V5 (right) in COS-7 cells. White arrowheads indicate large ring-like DSTYK-positive structures. b Double immunofluorescent staining of endogenous DSTYK with LAMP1 in COS-7 cells. c COS-7 cells transfected with DSTYK-V5 and double immunofluorescent staining of V5 with LAMP1 (top) and Rab7a (bottom). White arrows indicate large ring-like structures co-localization of DSTYK-V5 with LAMP1 and Rab7a. d Confocal images show the 2.5 dpf mosaic transgenic fishes expressing dstyk-GFP and LAMP1-mCherry (Tg(hsp70l:dstyk-GFP);Tg(hsp70l:LAMP1-mCherry)). Top panel show the single layer and bottom panel showed the 3D view. e Confocal images show the single layer of 2.5 dpf mosaic transgenic fishes expressing DSTYK-GFP and LAMP1-mCherry (Tg(hsp70l:DSTYK-GFP);Tg(hsp70l:LAMP1-mCherry)). Heat shocking at 72 hpf and imaging at about 78 hpf. f Representative images of LysoTracker Red staining of lysosome after transfected with control siRNA (top) and Dstyk siRNA (bottom) in COS-7 cells. g Quantifications of lysosome numbers after transfected with control siRNA or Dstyk siRNA. n = 10 independent views from three independent experiments, five cells were counted for each view. ***p < 0.001. p values were determined by unpaired two-tailed Student’s t-test. h Immunoblotting of LAMP1 and LAMP3 in COS-7 cells transfected with control siRNA and Dstyk siRNA. i Immunoblotting of Lamp1 and Lamp3 in WT and dstyk mutant zebrafish. Data are presented as mean ± SD. Scale bar represent 10 μm in (ac), and (f), 100 μm in (d, e). Source data are provided as a Source Data file.

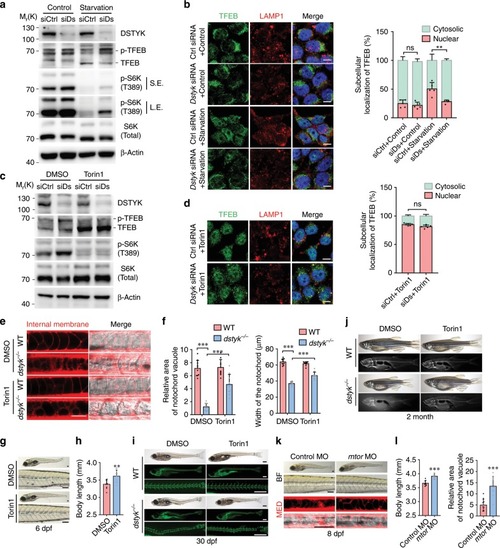
<italic>Dstyk</italic> regulates lysosome biogenesis through mTORC1/TFEB pathway.

a, c Immunoblotting of endogenous TFEB, p-TFEB (phosphorylated TFEB) and p-S6K(T389) in COS-7 cells transfected with control siRNA (siCtrl) or Dstyk siRNA (siDs), a cells without starvation (Control) or starved for 2 h. S.E./L.E., Shorter exposure/longer exposure. c cells treated with DMSO or Torin1 (1 µM) for 3 h. b, d Immunofluorescence for TFEB and LAMP1 in COS-7 cells transfected with control siRNA or Dstyk siRNA, b cells without starvation (Control) or starved for 2 h, d cells treated with Torin1 (1 µM) for 3 h. Quantifications of subcellular localization of endogenous TFEB (a percentage of total immunostaining colocalized with nuclear or cytosolic staining) was shown in right panel. n = 5 independent experiments, each experiment counted 10 cells. **p < 0.01. ej WT and mutant were treated with DMSO or 500 nM Torin1 from 20 to 30 hpf. Vacuole revealed by MED staining (left) at 48 hpf in (e). Quantification of relative area of notochord vacuole (left) (n = 10 independent embryos, each embryo counted 10 vacuoles) and notochord width (right) (n = 10 independent embryos) at 48 hpf in (f). ***p < 0.001. Bright-field images showing the 6 dpf mutants treated with DMSO (top) or Torin1 (bottom) in (g). Quantification of the body length of mutants in (h). n = 10 independent embryos. **p < 0.01. Calcein staining and bright-field images of about 30 dpf WT (top) and dstyk mutants (bottom) in (i). Whole mount and X-rays images of 2-month-old WT (top) and dstyk mutants (bottom) in (j). k Bright-field (top) and MED staining (bottom) images showing the 8 dpf dstyk mutants after injected with control (left) and mtor MO (right). l Quantification of the body length (left) (n = 10 independent embryos) and relative area of notochord vacuole (right) (n = 10 independent embryos, each embryo counted 10 vacuoles) after control and mtor MO injection. ***p < 0.001. p values in (b, d and f) determined by two-way ANOVA test, p values in (h and l) determined by unpaired two-tailed Student’s t-test. Data are presented as mean ± SD. Scale bar represent 10 μm in (b and d), and 50 μm in (e), 100 μm in (g and k), 500 μm in (i). Source data are provided as a Source Data file.

Schematic diagram for vertebral column development and proposed model for the regulation of mTORC1/TFEB pathway by DSTYK.

a The development process of notochord and vertebral column in WT and dstyk mutant (See also in “Discussion”). b Model depicting the proposed mechanistic regulation of TFEB by DSTYK. In normal cells, DSTYK could inhibit the activity of mTORC1, resulting in nuclear translocation of non-phosphorylated TFEB and promoting lysosomal and LRO genes transcription. In Dstyk-deficient cells, mTORC1 is activated and phosphorylates TFEB, resulting in reduced TFEB nuclear translocation and inhibition of lysosomal and LRO genes transcription.

ZFIN is incorporating published figure images and captions as part of an ongoing project. Figures from some publications have not yet been curated, or are not available for display because of copyright restrictions.

PHENOTYPE:
Fish:
Observed In:
Stage Range: 20-25 somites to Day 4

ZFIN is incorporating published figure images and captions as part of an ongoing project. Figures from some publications have not yet been curated, or are not available for display because of copyright restrictions.

ZFIN is incorporating published figure images and captions as part of an ongoing project. Figures from some publications have not yet been curated, or are not available for display because of copyright restrictions.

ZFIN is incorporating published figure images and captions as part of an ongoing project. Figures from some publications have not yet been curated, or are not available for display because of copyright restrictions.

ZFIN is incorporating published figure images and captions as part of an ongoing project. Figures from some publications have not yet been curated, or are not available for display because of copyright restrictions.

EXPRESSION / LABELING:
Gene:
Fish:
Anatomical Term:
Stage Range: Prim-5 to Day 4
PHENOTYPE:
Fish:
Observed In:
Stage Range: Prim-5 to Day 4
Acknowledgments
This image is the copyrighted work of the attributed author or publisher, and ZFIN has permission only to display this image to its users. Additional permissions should be obtained from the applicable author or publisher of the image. Full text @ Nat. Commun.