- Title
-
The Application of Methylprednisolone Nanoscale Zirconium-Porphyrin Metal-Organic Framework (MPS-NPMOF) in the Treatment of Photoreceptor Degeneration
- Authors
- Wang, Y., Liu, W., Yuan, B., Yin, X., Li, Y., Li, Z., Cui, J., Yuan, X., Li, Y.
- Source
- Full text @ Int. J. Nanomedicine
|
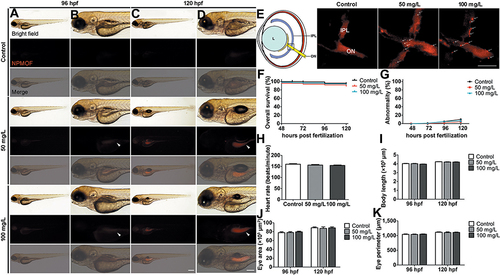
Phenotypes and tissue distribution of larval zebrafish following NPMOF exposure. Bright field and fluorescence images of larval zebrafish at (A and B) 96 and (C and D) 120 hpf. Columns (B) and (D) are magnified images of columns (A) and (C), respectively. Note that NPMOF gathers mainly in the gastrointestinal tract (arrowheads). (E) The NPMOF localization in sections taken from retinas in the control, 50 mg/L and 100 mg/L exposed groups at 120 hpf. Note that NPMOF localizes predominantly in the IPL and ON (arrows). The location of the image is shown by the square in the cartoon. (F) Statistical analysis of the survival rate. No significant difference was found among the control, 50 mg/L and 100 mg/L exposed groups (Log rank test, p>0.05). (G) Statistical analysis of the malformation rate, (H) heart rate at 120 hpf, (I) body length, (J) area and (K) perimeter of the eye ball at 96 hpf and 120 hpf. No significant difference was found among the three groups (ANOVA, p>0.05). (A-D) Dorsal is up, and rostral is left. Scale bar in (A) and (C): 200 μm; (B) and (D): 100 μm; (E): 10 μm. Abbreviations: L, lens; IPL, inner plexiform layer; ON, optic nerve. |
|
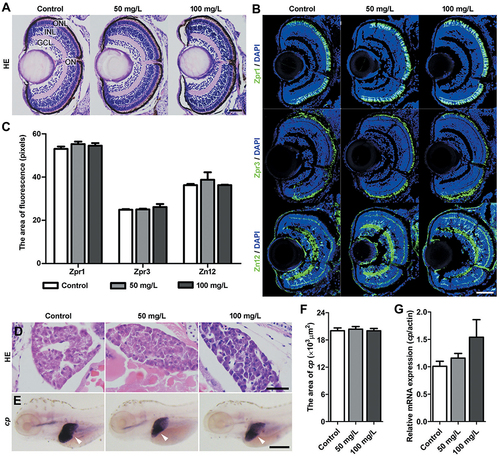
The histology of the retina and liver following NPMOF exposure. (A and B) Sections taken from the retina at 120 hpf. (A) HE staining; (B) Zpr1, Zpr3 and Zn12 staining. (C) Statistical analysis of Zpr1-positive, Zpr3-positive and Zn12-positive areas among the control, 50 mg/L and 100 mg/L exposed groups (ANOVA, p>0.05). (D) HE staining of the liver in the control, 50 mg/L and 100 mg/L groups. (E) Images of in situ hybridization. The expression of riboprobe ceruloplasmin (cp) mRNA is shown with arrowheads. (F) Statistical analysis of the liver size among the three groups (ANOVA, p>0.05). (G) The expression of cp. Dorsal is up and rostral is left in (E). Scale bar in (A) 20 μm; (B): 50 μm; (D): 20 μm; (E): 200 μm. Abbreviations: ONL, outer nuclear layer; INL, inner nuclear layer; GCL, ganglion cell layer; ON, optic nerve. |
|
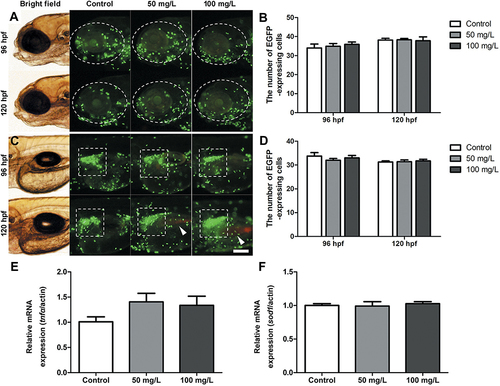
Inflammatory response following NPMOF exposure. (A and C) The distribution of neutrophils in the (A) ocular region and (C) hepatic region. (B and D) Statistical analysis of the number of neutrophils in the ocular (A, circle) and hepatic regions (C, square), respectively. The red fluorescence is emitted by NPMOF in the gastrointestinal tract (C, arrowheads). (E and F) The expression of tnfα and sod1. Dorsal is up and rostral is left in (A) and (C). Scale bar in (A): 100 μm. |
|
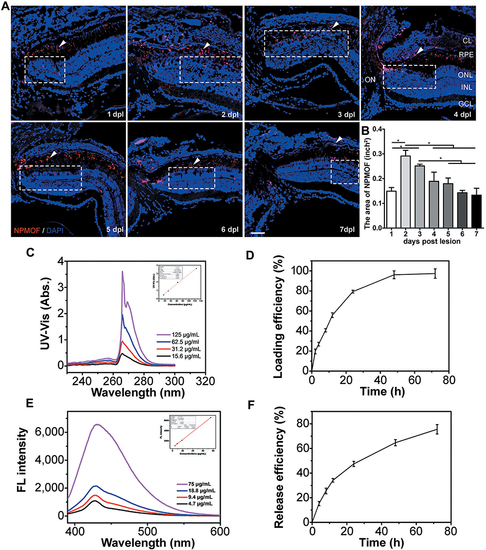
Distribution of NPMOF in the retina from 1 to 7 days post lesion and the loading efficiency and release efficiency for MPS in NPMOF. (A) The distribution of NPMOF (arrowheads) around the lesioned area (dotted rectangles) in the retina from 1 to 7 dpl. (B) The statistical analysis of NPMOF in the retina (ANOVA, *p<0.05). (C and D) The UV-Vis absorbance (insert, standard curve) of MPS in DMF and its loading performance. (E and F) The fluorescence (insert, standard curve) of MPS in 5% hyaluronic acid and its release performance. Scale bar in (A): 50 μm. Abbreviations: CL, choroid layer; RPE, retinal pigment epithelium; ONL, outer nuclear layer; INL, inner nuclear layer; GCL, ganglion cell layer; ON, optic nerve. |
|
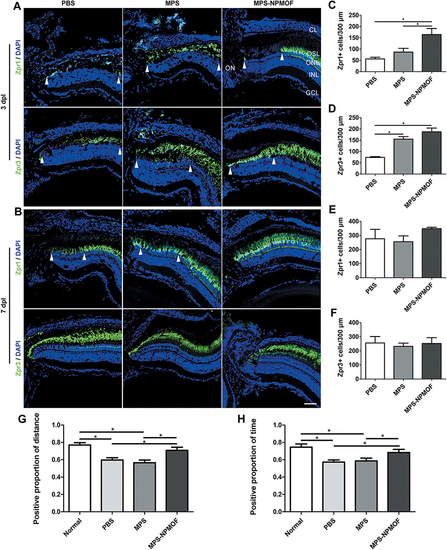
Degeneration-regeneration of photoreceptors and changes in visual function following treatment with MPS-NPMOF. (A and B) Zpr1 and Zpr3 staining in sections taken from retinas in the PBS, MPS and MPS-NPMOF groups at 3 and 7 dpl. Note that retinas in the PBS and MPS groups have a loose arrangement of Zpr1-positive cells at lesioned sites (arrowheads) at 7 dpl. (C and D) Quantification of the number of cones and rods per 300 microns in the lesioned retina at 3 dpl. More photoreceptors remained in the MPS-NPMOF group compared to the PBS and MPS groups (ANOVA, *p<0.05). (E and F) Quantification of the number of cones and rods per 300 microns at 7 dpl. There are no significant differences among the three groups (ANOVA, p>0.05). (G and H) The statistical analyses of the positive proportion of distance and positive proportion of time at 7 dpl. Note that the significant decrease in the PBS and MPS groups (ANOVA, *p<0.05). Scale bar in (A) and (B): 50 μm. Abbreviations: CL, choroid layer; OSL, outer segment layer; ONL, outer nuclear layer; INL, inner nuclear layer; GCL, ganglion cell layer; ON, optic nerve. |
|
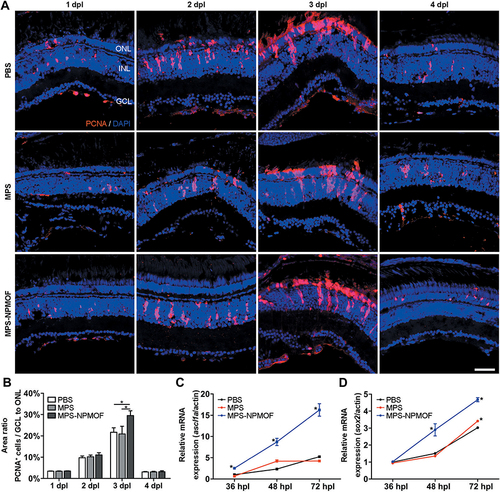
Cell proliferation of light-lesioned retina following injection of MPS-NPMOF. (A) PCNA staining in sections taken from retinas at 1, 2, 3 and 4 dpl. (B) Statistical analysis of the percentage of PCNA-positive cells from GCL to ONL. There was a significantly higher percentage in the MPS-NPMOF group than in the PBS and MPS groups at 3 dpl (ANOVA, *p<0.05). (C and D) The expression of ascl1a and sox2 mRNA. Note that ascl1a was increased in the MPS-NPMOF group at 36, 48 and 72 hpl, while sox2 was increased at 48 and 72 hpl (ANOVA, *p<0.05). Scale bar in (A): 20 μm. Abbreviations: ONL, outer nuclear layer; INL, inner nuclear layer; GCL, ganglion cell layer. |

