
|
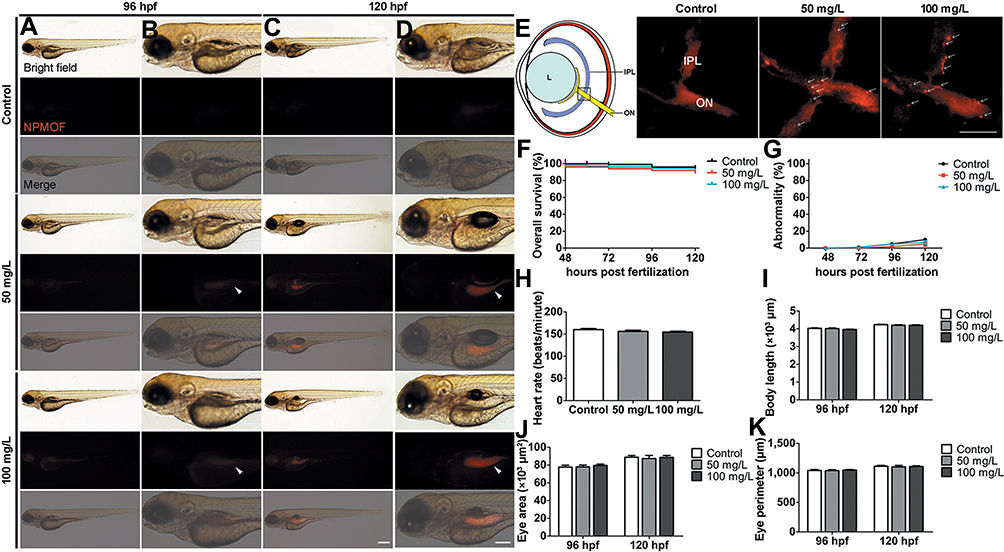
Fig. 2 Phenotypes and tissue distribution of larval zebrafish following NPMOF exposure. Bright field and fluorescence images of larval zebrafish at (A and B) 96 and (C and D) 120 hpf. Columns (B) and (D) are magnified images of columns (A) and (C), respectively. Note that NPMOF gathers mainly in the gastrointestinal tract (arrowheads). (E) The NPMOF localization in sections taken from retinas in the control, 50 mg/L and 100 mg/L exposed groups at 120 hpf. Note that NPMOF localizes predominantly in the IPL and ON (arrows). The location of the image is shown by the square in the cartoon. (F) Statistical analysis of the survival rate. No significant difference was found among the control, 50 mg/L and 100 mg/L exposed groups (Log rank test, p>0.05). (G) Statistical analysis of the malformation rate, (H) heart rate at 120 hpf, (I) body length, (J) area and (K) perimeter of the eye ball at 96 hpf and 120 hpf. No significant difference was found among the three groups (ANOVA, p>0.05). (A-D) Dorsal is up, and rostral is left. Scale bar in (A) and (C): 200 μm; (B) and (D): 100 μm; (E): 10 μm. Abbreviations: L, lens; IPL, inner plexiform layer; ON, optic nerve.