
|
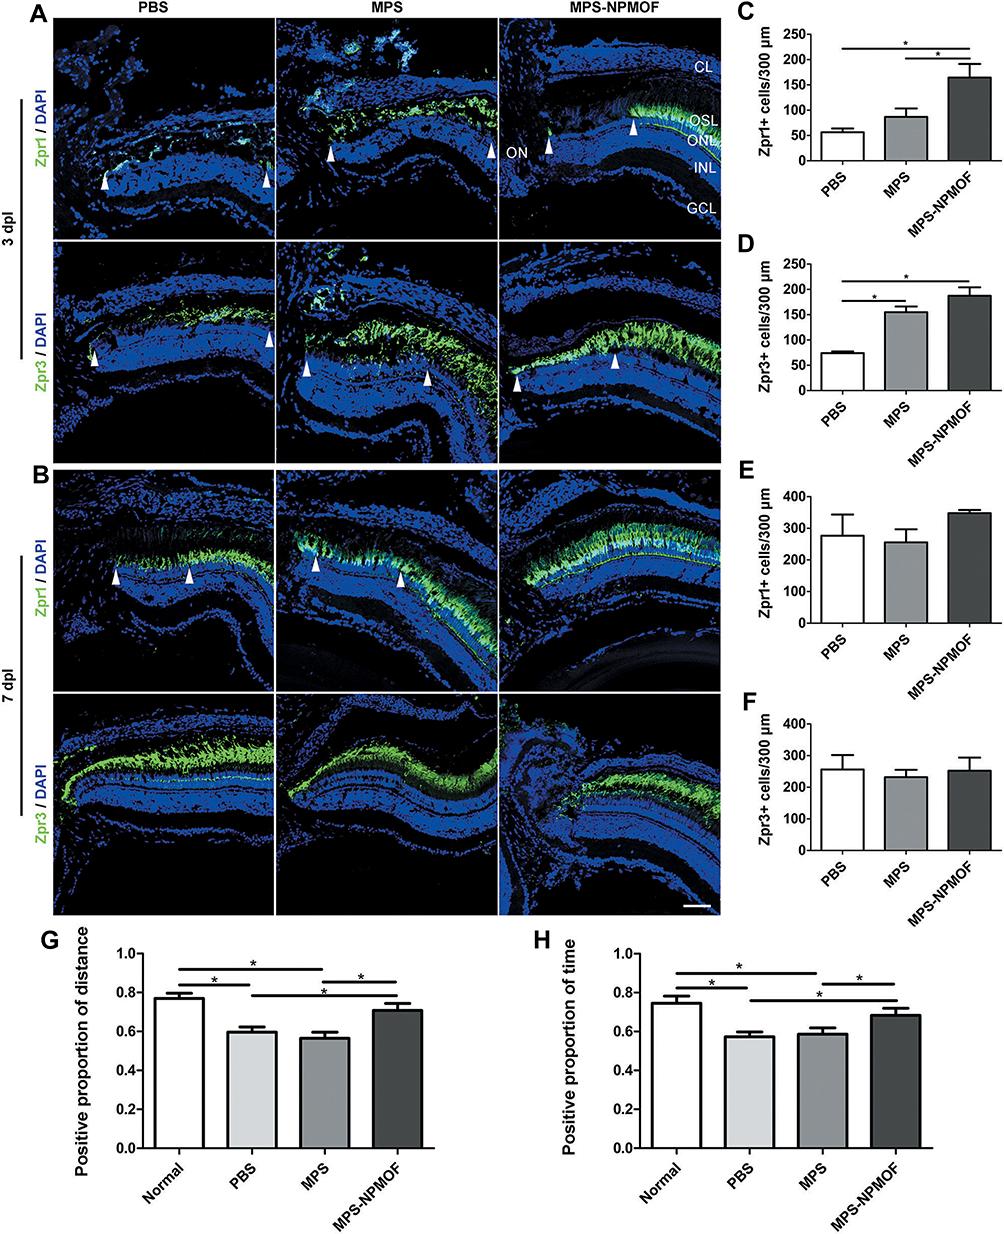
Fig. 6 Degeneration-regeneration of photoreceptors and changes in visual function following treatment with MPS-NPMOF. (A and B) Zpr1 and Zpr3 staining in sections taken from retinas in the PBS, MPS and MPS-NPMOF groups at 3 and 7 dpl. Note that retinas in the PBS and MPS groups have a loose arrangement of Zpr1-positive cells at lesioned sites (arrowheads) at 7 dpl. (C and D) Quantification of the number of cones and rods per 300 microns in the lesioned retina at 3 dpl. More photoreceptors remained in the MPS-NPMOF group compared to the PBS and MPS groups (ANOVA, *p<0.05). (E and F) Quantification of the number of cones and rods per 300 microns at 7 dpl. There are no significant differences among the three groups (ANOVA, p>0.05). (G and H) The statistical analyses of the positive proportion of distance and positive proportion of time at 7 dpl. Note that the significant decrease in the PBS and MPS groups (ANOVA, *p<0.05). Scale bar in (A) and (B): 50 μm. Abbreviations: CL, choroid layer; OSL, outer segment layer; ONL, outer nuclear layer; INL, inner nuclear layer; GCL, ganglion cell layer; ON, optic nerve.