
|
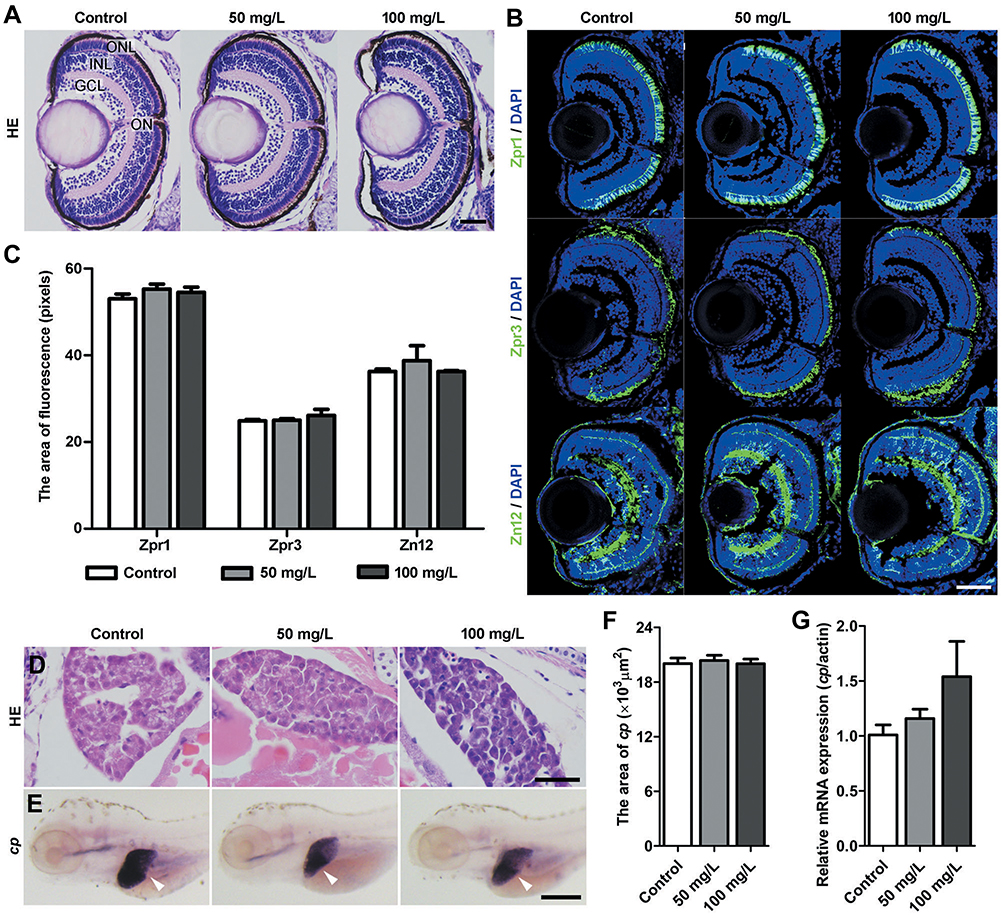
Fig. 3 The histology of the retina and liver following NPMOF exposure. (A and B) Sections taken from the retina at 120 hpf. (A) HE staining; (B) Zpr1, Zpr3 and Zn12 staining. (C) Statistical analysis of Zpr1-positive, Zpr3-positive and Zn12-positive areas among the control, 50 mg/L and 100 mg/L exposed groups (ANOVA, p>0.05). (D) HE staining of the liver in the control, 50 mg/L and 100 mg/L groups. (E) Images of in situ hybridization. The expression of riboprobe ceruloplasmin (cp) mRNA is shown with arrowheads. (F) Statistical analysis of the liver size among the three groups (ANOVA, p>0.05). (G) The expression of cp. Dorsal is up and rostral is left in (E). Scale bar in (A) 20 μm; (B): 50 μm; (D): 20 μm; (E): 200 μm. Abbreviations: ONL, outer nuclear layer; INL, inner nuclear layer; GCL, ganglion cell layer; ON, optic nerve.