FIGURE SUMMARY
Title

Microarray and metabolome analysis of hepatic response to fasting and subsequent refeeding in zebrafish (Danio rerio)

Authors
Jia, J., Qin, J., Yuan, X., Liao, Z., Huang, J., Wang, B., Sun, C., Li, W.
Source
Full text @ BMC Genomics

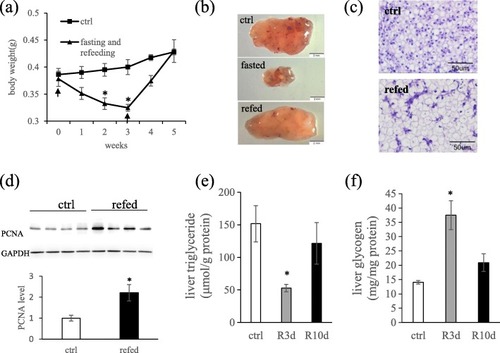
Effects of fasting and refeeding on zebrafish body weight and hepatocyte morphology. a Growth curve of zebrafish during fasting and refeeding. Arrows represent the start of fasting and refeeding, respectively; asterisks denote significant differences between fasting and the control group at the same stage (P < 0.05), n = 5–6. b Representative gross liver tissues from zebrafish fed ad libitum (ctrl), fasted for 3 weeks (fasted) and re-fed 3 days after a 3-week fast (refed). Scale bar, 2 mm. c H&E staining of liver samples from fed ad libitum (ctrl) and re-fed for 3 days following a 3-week starvation (refed). d Western blot analysis of PCNA expression in liver of zebrafish fed ad libitum (ctrl) and re-fed 3 days after a 3-week fast (refed), n = 4. e Triglyceride (TG) content in zebrafish liver when refed for 3 days (R3d) and 10 days (R10d) after a 3-weeks fasting, n = 4. f Glycogen content in zebrafish liver when refed for 3 days (R3d) and 10 days (R10d) after a 3-weeks fasting, n = 4–6. Error bars were ± SEM. For d, e and f, asterisks denote significant differences between refed group and the control group (P < 0.05)

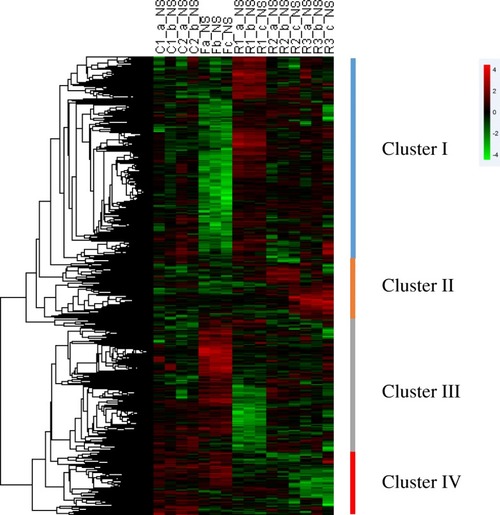
Hierarchical clustering of differentially expressed genes during fasting and refeeding in zebrafish liver. Unsupervised clustering of differentially expressed genes led to the formation of four distinct clusters (I, II, III and IV). Each row represented the temporal expression pattern of a single gene and each column represented a single sample. Columns 1 to 4, liver samples from continuously fed group; columns 5 to 7, liver samples at fasted for 3 weeks; columns 8 to 10, liver samples at day 3 after refeeding; columns 11 to 13, liver samples at day 10 after refeeding; columns 14 to 16, liver samples at day 15 after refeeding. The expression levels were represented by colored tags, with red representing higher levels of expression and green representing lower levels of expression

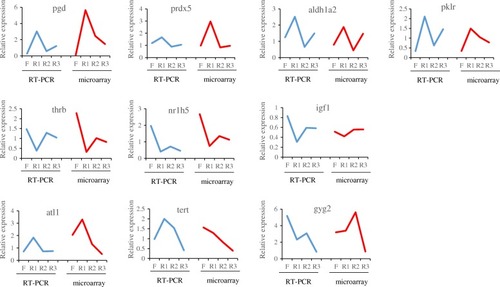
Comparison of RT-PCR and microarray expression ratios for selected genes. Blue curves represented results from RT-PCR, n = 8–10; red curves represented results of microarray results. F, R1, R2 and R3 represented liver samples of fasted for 3 weeks, refed for 3 days, refed for 10 days and refed for 15 days

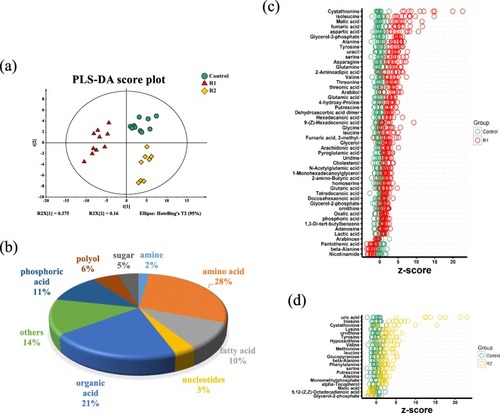
Metabolic profiles of zebrafish liver during refeeding. a Score plot of the PLS-DA model from all detected metabolites. b Category of detected metabolites. c Z-score scatter diagrams of differential metabolites in R1 (refed 3 days) period based on control. d Z-score scatter diagrams of differential metabolites in R2 (refed 10 days) period based on control. For c and d, the data from tested groups were separately scaled to the mean and standard deviation of control. Each point represented one metabolite in one technical repeat and was colored by sample types

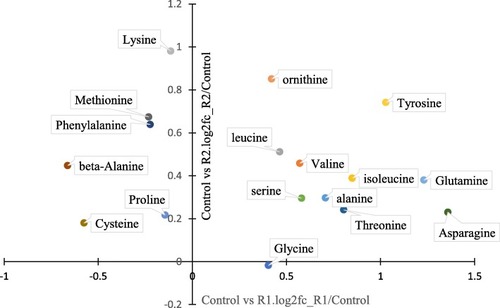
Scatter diagram of amino acid levels comparing to control group during R1 (refed 3 days) and R2 (refed 10 days) period

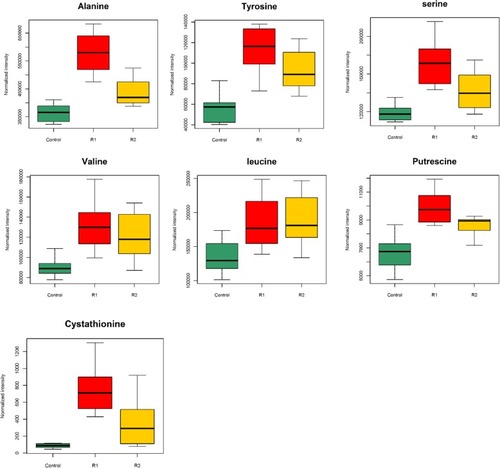
Boxplots represented metabolites differences in R1 (refed 3 days) and R2 (refed 10 days) period comparing to the control group

Acknowledgments
This image is the copyrighted work of the attributed author or publisher, and ZFIN has permission only to display this image to its users. Additional permissions should be obtained from the applicable author or publisher of the image. Full text @ BMC Genomics