
Fig. 2
- ID
- ZDB-FIG-191230-337
- Publication
- Jia et al., 2019 - Microarray and metabolome analysis of hepatic response to fasting and subsequent refeeding in zebrafish (Danio rerio)
- Other Figures
- All Figure Page
- Back to All Figure Page
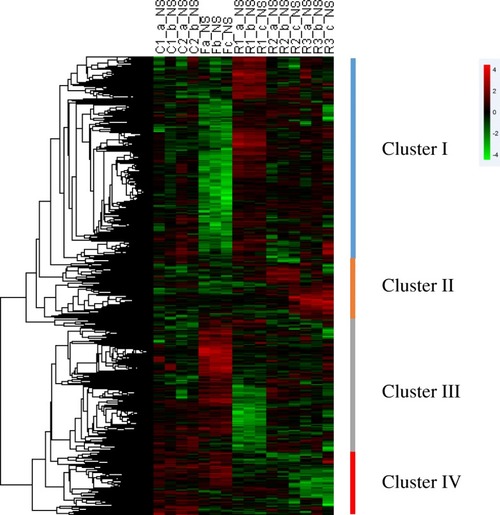
Hierarchical clustering of differentially expressed genes during fasting and refeeding in zebrafish liver. Unsupervised clustering of differentially expressed genes led to the formation of four distinct clusters (I, II, III and IV). Each row represented the temporal expression pattern of a single gene and each column represented a single sample. Columns 1 to 4, liver samples from continuously fed group; columns 5 to 7, liver samples at fasted for 3 weeks; columns 8 to 10, liver samples at day 3 after refeeding; columns 11 to 13, liver samples at day 10 after refeeding; columns 14 to 16, liver samples at day 15 after refeeding. The expression levels were represented by colored tags, with red representing higher levels of expression and green representing lower levels of expression |