IMAGE

Fig. 1

ID
ZDB-IMAGE-191230-365
Source
Figures for Jia et al., 2019
Image
Figure Caption

Fig. 1

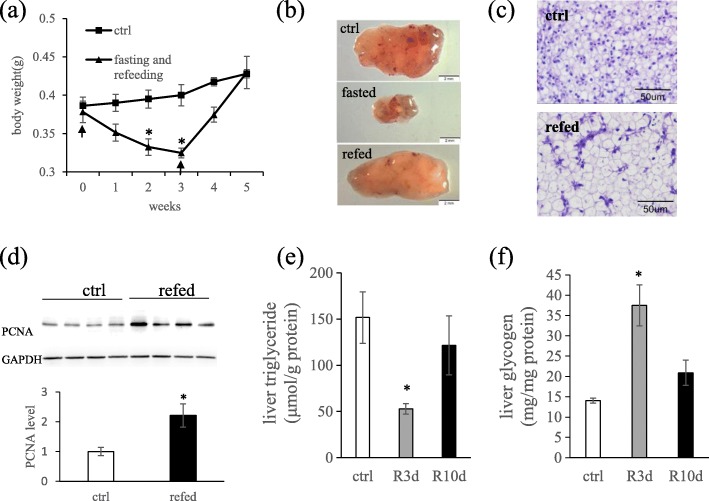
Effects of fasting and refeeding on zebrafish body weight and hepatocyte morphology. a Growth curve of zebrafish during fasting and refeeding. Arrows represent the start of fasting and refeeding, respectively; asterisks denote significant differences between fasting and the control group at the same stage (P < 0.05), n = 5–6. b Representative gross liver tissues from zebrafish fed ad libitum (ctrl), fasted for 3 weeks (fasted) and re-fed 3 days after a 3-week fast (refed). Scale bar, 2 mm. c H&E staining of liver samples from fed ad libitum (ctrl) and re-fed for 3 days following a 3-week starvation (refed). d Western blot analysis of PCNA expression in liver of zebrafish fed ad libitum (ctrl) and re-fed 3 days after a 3-week fast (refed), n = 4. e Triglyceride (TG) content in zebrafish liver when refed for 3 days (R3d) and 10 days (R10d) after a 3-weeks fasting, n = 4. f Glycogen content in zebrafish liver when refed for 3 days (R3d) and 10 days (R10d) after a 3-weeks fasting, n = 4–6. Error bars were ± SEM. For d, e and f, asterisks denote significant differences between refed group and the control group (P < 0.05)

Acknowledgments
This image is the copyrighted work of the attributed author or publisher, and ZFIN has permission only to display this image to its users. Additional permissions should be obtained from the applicable author or publisher of the image. Full text @ BMC Genomics