
Image
|
Figure Caption
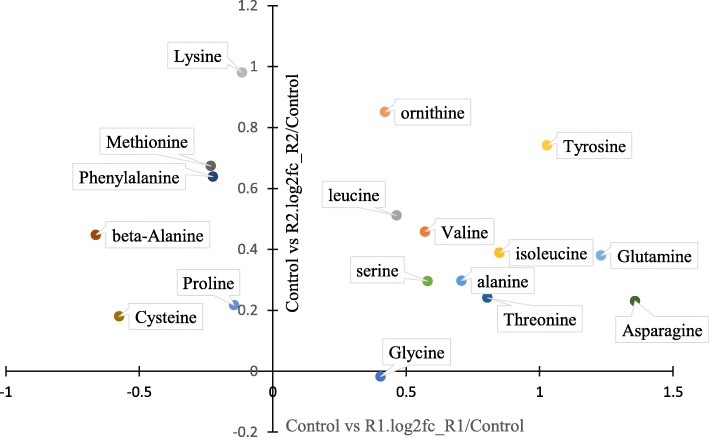
Fig. 5
Scatter diagram of amino acid levels comparing to control group during R1 (refed 3 days) and R2 (refed 10 days) period
Acknowledgments
This image is the copyrighted work of the attributed author or publisher, and
ZFIN has permission only to display this image to its users.
Additional permissions should be obtained from the applicable author or publisher of the image.
Full text @ BMC Genomics