
Image
|
Figure Caption
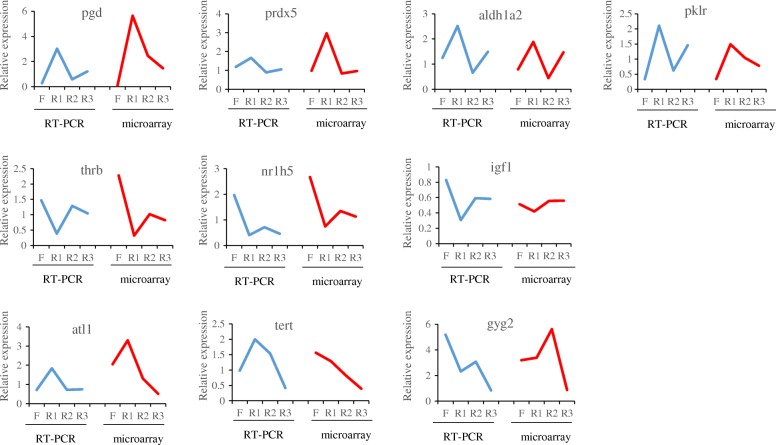
Fig. 3
Comparison of RT-PCR and microarray expression ratios for selected genes. Blue curves represented results from RT-PCR,
Acknowledgments
This image is the copyrighted work of the attributed author or publisher, and
ZFIN has permission only to display this image to its users.
Additional permissions should be obtained from the applicable author or publisher of the image.
Full text @ BMC Genomics