
FIGURE
Fig. 5
- ID
- ZDB-FIG-191230-340
- Publication
- Jia et al., 2019 - Microarray and metabolome analysis of hepatic response to fasting and subsequent refeeding in zebrafish (Danio rerio)
- Other Figures
- All Figure Page
- Back to All Figure Page
Fig. 5
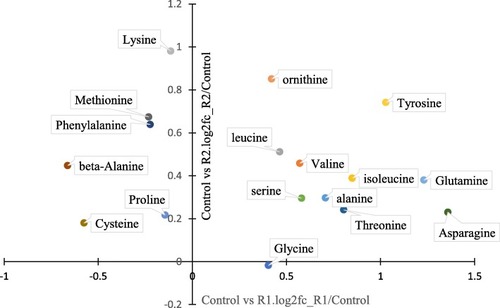
Scatter diagram of amino acid levels comparing to control group during R1 (refed 3 days) and R2 (refed 10 days) period |
Expression Data
Expression Detail
Antibody Labeling
Phenotype Data
Phenotype Detail
Acknowledgments
This image is the copyrighted work of the attributed author or publisher, and
ZFIN has permission only to display this image to its users.
Additional permissions should be obtained from the applicable author or publisher of the image.
Full text @ BMC Genomics