FIGURE SUMMARY
Title

Structural and functional conservation of non-lumenized lymphatic endothelial cells in the mammalian leptomeninges

Authors
Shibata-Germanos, S., Goodman, J.R., Grieg, A., Trivedi, C.A., Benson, B.C., Foti, S.C., Faro, A., Castellan, R.F.P., Correra, R.M., Barber, M., Ruhrberg, C., Weller, R.O., Lashley, T., Iliff, J.J., Hawkins, T.A., Rihel, J.
Source
Full text @ Acta Neuropathol.

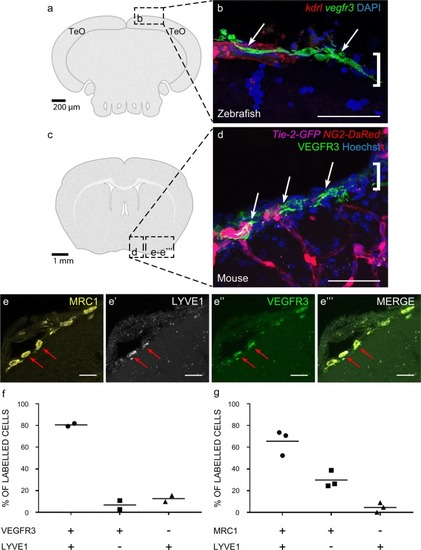
Cells with BLEC molecular markers are present within the mouse leptomeninges. a Coronal brain section of adult zebrafish brain indicating the imaging area in the dorsal optic tectum (TeO). b A 14 month old Tg(kdr-l:mCherry); Tg(flt4:mCitrine) double transgenic zebrafish has cells in the meninges (white bracket) that express flt4/vegfr3 (α-GFP, green) near kdr-l positive (α-RFP, red) blood vessels. DAPI (blue) labels the nuclei. Scale = 50 µm. c Coronal mouse brain section showing the imaging areas of the meninges. d As revealed by IHC, 17-week-old mouse brains express VEGFR3 (green) in the meninges (white bracket). Tie2-GFP;NG2-DsRed double reporter mice were used to distinguish arteries and veins. NG2 (red) labels pericytes and smooth muscle cells, Tie2 (magenta) labels vascular endothelial cells, and Hoechst (blue) stains nuclei. The image is rotated with the parenchyma at the bottom for ease of comparison with panel b. Scale = 50 µm. e-e′′′ As revealed by IHC, cells of the meninges co-express MRC1 (e, yellow), LYVE1 (e′, white), and VEGFR3 (e′′, green). Red arrows highlight cells expressing these three markers. The images are rotated with the parenchyma at the bottom. scale = 30 µm. f, g Quantification of the relative numbers of single and double-labelled cells in 2-month old mouse meninges. VEGFR3 and LYVE1 cell counts were from n = 2 brains, 3 coronal sections (10 area images)/brain. MRC1 and LYVE1 cell counts were from n = 3 brains, 3 coronal sections (4 area images)/brain. The mean values for each set are depicted

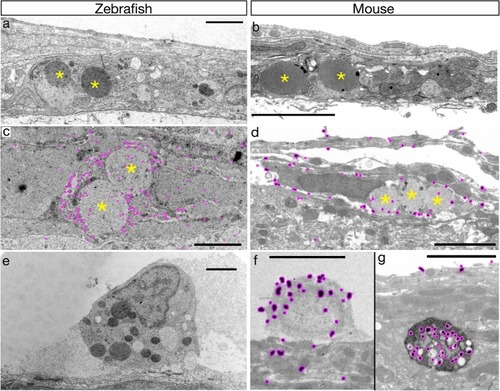
Ultrastructural properties of BLECs/LLECs are conserved in zebrafish and mice. a Representative TEM micrograph of adult zebrafish meninges. The large, round, densely and homogenously-stained inclusions (yellow asterisks) of a putative BLEC are indicated. Scale bar = 2.5 µm (in all images). n = 2 brains. b Representative TEM micrograph of adult mouse leptomeninges. Putative LLECs have their large inclusions marked with yellow asterisks. n = 2 brains. c Cells with large inclusions (yellow asterisks) characteristic of BLECs are immunologically labelled with post-embed detection of GFP in Tg(flt4:gfp) adult brains using a 20 nm gold-labelled secondary. Minimal contrast staining was used to prevent obscuring of the nanogold particles (highlighted in magenta). n = 2 brains. d Mouse meningeal cells with large inclusions (yellow asterisks) are labelled by pre-embed detection of LYVE1 using a nanogold secondary with silver-enhancement. The silver grains are highlighted with magenta. Note the LYVE1-positive cell has silver grains present near the outer membrane. n = 2 brains. e An example of a GFP-negative cell in zebrafish Tg(flt4:gfp) adult meninges with similar ultrastructural properties to macrophages. n = 2 brains. f A second population of LYVE1-positive cells in the mouse leptomeninges contain multiple small, irregular, heterogeneous vesicles with silver grains (magenta) present within the cytoplasm and vesicles. These cells are ultrastructurally similar to macrophages (e). n = 2 brains

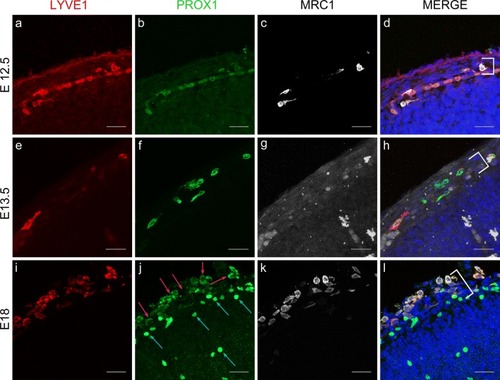
Cells expressing LLEC markers are present within embryonic mouse leptomeninges. ad As revealed by IHC, E12.5 mouse meninges (white bracket) contain cells that co-express LYVE1 (red), PROX1 (green), and MRC1 (white). DAPI marks the nuclei in blue (d). Scale = 30 µm. n = 3 brains. eh E13.5 mouse meninges (white bracket) contain cells that co-express LYVE1 (red), PROX1 (green), and MRC1 (white). DAPI marks the nuclei in blue (h). Scale = 30 µm. n = 3 brains. il E18 mouse meninges (white bracket) contain cells that co-express LYVE1 (red), PROX1 (green), and MRC1 (white). PROX1 is cytoplasmic (j, red arrows) in the meninges but nuclear in neurons (j, blue arrows). DAPI marks the nuclei in blue (l). Scale = 30 µm. n = 3 brains

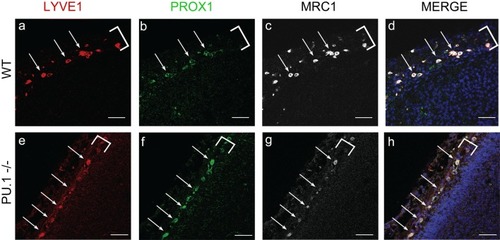
Mouse LLECs develop independent of the transcription factor PU.1. ad As detected by IHC, E15.5 wild-type mice have cells that co-express LYVE1 (a, red) PROX1 (b, green) and MRC1 (c, white) in the developing meninges (white bracket). DAPI labels nuclei blue in the merged image (d). White arrows indicate cells with these three markers. Scale = 50 µm. n = 2 brains. e–h) The meninges (white bracket) of E15.5 PU.1 knockout siblings contain many cells (white arrows) that co-express LYVE1 (e, red), PROX1 (f, green), and MRC1 (g, white). Scale = 50 µm. n = 3 brains

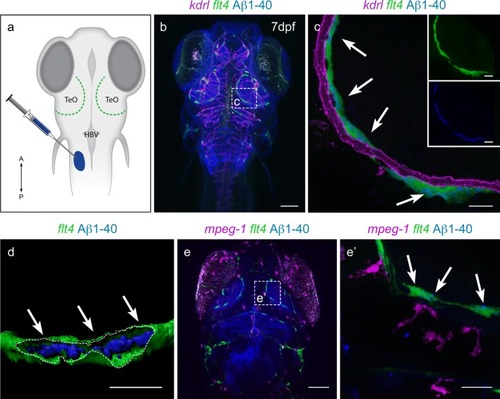
Zebrafish BLECs, but not macrophages, take up Aβ1-40. a Schematic showing the location of BLECs (green) relative to the Aβ1-40 injection site into a pocket of CSF near the hindbrain ventricle (HBV). TeO = Optic Tectum. n = 4 brains b Confocal projection of double transgenic Tg(kdr-l:mCherry); Tg(flt4:mCitrine);casper 7dpf larvae, which labels vasculature in red and BLECs in green, injected with Aβ1-40 (blue). Dotted box detailed in (c). Scale = 150 µm. n = 4 brains c After injection, Aβ1-40 (blue) accumulates within mCitrine-positive BLECs (green, white arrows showing co-localization) but not within mCherry-positive vasculature (magenta). The green (BLECs) and blue (Aβ1-40) channels are shown separately in the insets. Scale = 30 µm. n = 4 brains. d A 3-D reconstruction of the mCitrine positive BLEC (green) shows a cutaway (dotted line) into the interior portion of the cell to highlight the internalization of Aβ1-40 (blue with white arrows). Scale = 15 µm. n = 4 brains. e A representative confocal projection of double transgenic Tg(mpeg1:mCherry); Tg(flt4:mCitrine);nacre/ 7dpf larvae, which labels macrophages in magenta and BLECs in green, injected with Aβ1-40 (blue). The white dotted box is detailed in (e′) showing Aβ1-40 (blue) accumulates within mCitrine-positive BLECs (green) but not within mCherry-positive macrophages (magenta). White arrows point to co-localization of green BLECs with blue Aβ1-40. Scale = 30 µm. n = 3 brains

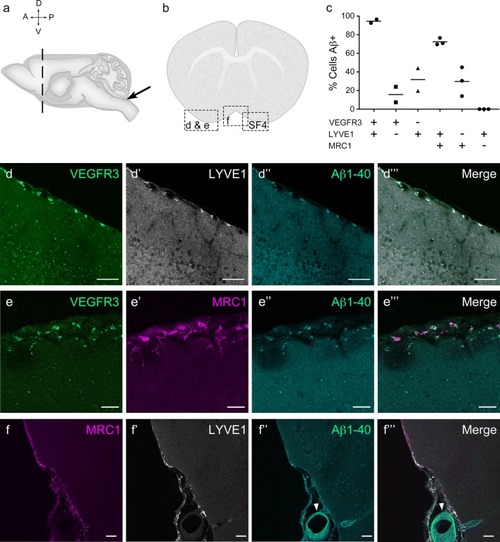
Mouse LLECs take up Aβ 1-40. a Schematic showing the site of dye and Aβ1-40 perfusion into the CSF via the cisterna magna (arrow) of a 2-month old mouse. The dotted line indicates the plane of section. A anterior, P posterior, D dorsal, V ventral. b Coronal brain section indicating the areas imaged. SF4 refers to area captured in Figure S4. c The percentage of each labelled cell type that internalized perfused Aβ. Cells co-expressing VEGFR3 and LYVE1 take up Aβ at a higher rate than MRC1, LYVE1 double-positive cells as well as MRC1-positive, LYVE1-negative cells (p ≤ 0.05, bootstrap). VEGFR3, LYVE1 counts, n = 2 brains (3 sections/brain). MRC1, LYVE1 counts, n = 3 brains (3 sections/brain). d–d′′′ Cells of the adult mouse meninges that co-express VEGFR3 (d, green) and LYVE1 (d′, white) internalize Aβ1-40 (d′′, cyan). Scale = 20 µm. e-e′′′) Cells of the adult mouse meninges that co-express VEGFR3 (e, green) and MRC1 (e′, white) internalize Aβ1-40 (e′′, cyan). Scale = 40 µm. ff′′′) Cells of the adult mouse meninges that co-express MRC1 (f, magenta) and LYVE1 (f′, white) internalize Aβ1-40 (f′′, cyan). The walls of a blood vessel (white arrowhead, f′′) also accumulate Aβ1-40. Scale = 60 µm

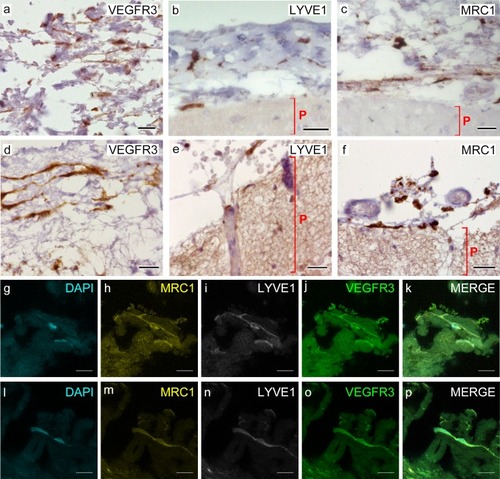
Cells of human meninges co-express LLEC markers. ac DAB-IHC with single antibodies detects VEGFR3 (a), LYVE1 (b), and MRC1 (c) in the meninges of human post mortem brain showing no signs of neuropathology. These images are taken from a 38 year old male (sample P17/07, Table 1), and confirmed in n = 2 additional samples. P parenchyma. Scale = 150 µm (a); 40 µm (b); and 20 µm (c). df DAB-IHC with single antibodies detects VEGFR3 (b), LYVE1 (c), and MRC1 (d) in elderly human meninges (age: 89–92) with evidence of neuropathology and confirmed in n = 3 brains (Table 1). P, parenchyma. Scale = 20 µm. g–p IHC with fluorescent antibodies detects human meningeal cells that co-express MRC1 (h, m, yellow), LYVE1 (i, n, white), and VEGFR3 (j, o, green). Nuclei/RNA are labelled with DAPI (g, l, blue) and images are merged in (k, p). Scale = 10 µm

Acknowledgments
This image is the copyrighted work of the attributed author or publisher, and ZFIN has permission only to display this image to its users. Additional permissions should be obtained from the applicable author or publisher of the image. Full text @ Acta Neuropathol.