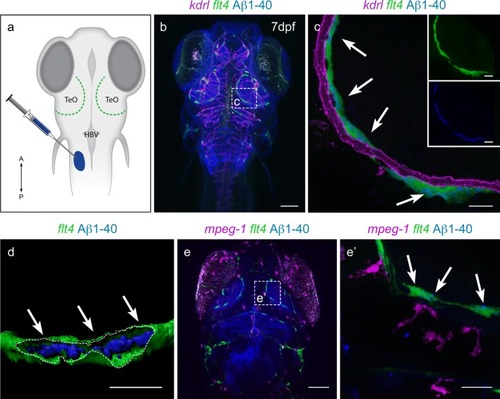
Zebrafish BLECs, but not macrophages, take up Aβ1-40. a Schematic showing the location of BLECs (green) relative to the Aβ1-40 injection site into a pocket of CSF near the hindbrain ventricle (HBV). TeO = Optic Tectum. n = 4 brains b Confocal projection of double transgenic Tg(kdr-l:mCherry); Tg(flt4:mCitrine);casper 7dpf larvae, which labels vasculature in red and BLECs in green, injected with Aβ1-40 (blue). Dotted box detailed in (c). Scale = 150 µm. n = 4 brains c After injection, Aβ1-40 (blue) accumulates within mCitrine-positive BLECs (green, white arrows showing co-localization) but not within mCherry-positive vasculature (magenta). The green (BLECs) and blue (Aβ1-40) channels are shown separately in the insets. Scale = 30 µm. n = 4 brains. d A 3-D reconstruction of the mCitrine positive BLEC (green) shows a cutaway (dotted line) into the interior portion of the cell to highlight the internalization of Aβ1-40 (blue with white arrows). Scale = 15 µm. n = 4 brains. e A representative confocal projection of double transgenic Tg(mpeg1:mCherry); Tg(flt4:mCitrine);nacre−/− 7dpf larvae, which labels macrophages in magenta and BLECs in green, injected with Aβ1-40 (blue). The white dotted box is detailed in (e′) showing Aβ1-40 (blue) accumulates within mCitrine-positive BLECs (green) but not within mCherry-positive macrophages (magenta). White arrows point to co-localization of green BLECs with blue Aβ1-40. Scale = 30 µm. n = 3 brains
|
