IMAGE

Fig. 5

ID
ZDB-IMAGE-200213-15
Source
Figures for Shibata-Germanos et al., 2019
Image
Figure Caption

Fig. 5

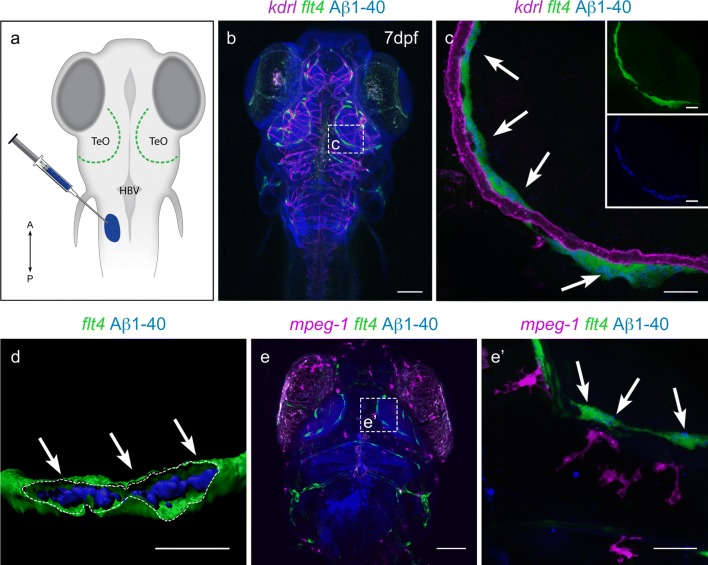
Zebrafish BLECs, but not macrophages, take up Aβ1-40. a Schematic showing the location of BLECs (green) relative to the Aβ1-40 injection site into a pocket of CSF near the hindbrain ventricle (HBV). TeO = Optic Tectum. n = 4 brains b Confocal projection of double transgenic Tg(kdr-l:mCherry); Tg(flt4:mCitrine);casper 7dpf larvae, which labels vasculature in red and BLECs in green, injected with Aβ1-40 (blue). Dotted box detailed in (c). Scale = 150 µm. n = 4 brains c After injection, Aβ1-40 (blue) accumulates within mCitrine-positive BLECs (green, white arrows showing co-localization) but not within mCherry-positive vasculature (magenta). The green (BLECs) and blue (Aβ1-40) channels are shown separately in the insets. Scale = 30 µm. n = 4 brains. d A 3-D reconstruction of the mCitrine positive BLEC (green) shows a cutaway (dotted line) into the interior portion of the cell to highlight the internalization of Aβ1-40 (blue with white arrows). Scale = 15 µm. n = 4 brains. e A representative confocal projection of double transgenic Tg(mpeg1:mCherry); Tg(flt4:mCitrine);nacre/ 7dpf larvae, which labels macrophages in magenta and BLECs in green, injected with Aβ1-40 (blue). The white dotted box is detailed in (e′) showing Aβ1-40 (blue) accumulates within mCitrine-positive BLECs (green) but not within mCherry-positive macrophages (magenta). White arrows point to co-localization of green BLECs with blue Aβ1-40. Scale = 30 µm. n = 3 brains

Acknowledgments
This image is the copyrighted work of the attributed author or publisher, and ZFIN has permission only to display this image to its users. Additional permissions should be obtained from the applicable author or publisher of the image. Full text @ Acta Neuropathol.