FIGURE SUMMARY
Title

Notch signaling restricts FGF pathway activation in parapineal cells to promote their collective migration

Authors
Wei, L., Al Oustah, A., Blader, P., Roussigné, M.
Source
Full text @ Elife

<italic>rbpja/b</italic> morphants phenocopy <italic>mindbomb</italic> mutants.

(A–B’) Confocal sections showing the expression of gfi1ab (red) at 48 hpf in control embryos (A, n = 33) and in two representative embryos injected with 4 ng of rbpja/b morpholinos (MO) (B, B’); sections are merged with nuclear staining (gray) to highlight the epiphysis (white circle) and parapineal (yellow circle). Embryo view is dorsal, anterior is up; scale bar = 10 µm. (C–D) Dot plots showing the number of Tg(dusp6:d2EGFP) positive parapineal cells (C) and the mean position of parapineal cells highlighted by nuclei staining (Topro-3) (D) at 32 hpf in embryos injected with 4 ng rbpja/b MO (orange dots; n = 36) or in controls (blue dots; n = 28). (E–F) Dot plots showing the mean position (E) or the number (F) of gfi1ab expressing parapineal cells in non-injected controls (blue dots, n = 33) or in rbpja/b MO injected embryos (orange dots, n = 46) at 48 hpf. Both the migration (distance from the midline; p-value=0.0001 in Welch t-test on absolute value) and laterality (left orientation of migration; p-value=0.0002 on Wilcoxon test) are affected in rbpja/b morphants (E). The number of gfi1ab+ cells is also increased in rbpja/b morphants (F, *** p-value<0.0001; Welch t-test). Data are representative of three (A–B’, E–F) or two experiments (C–D).

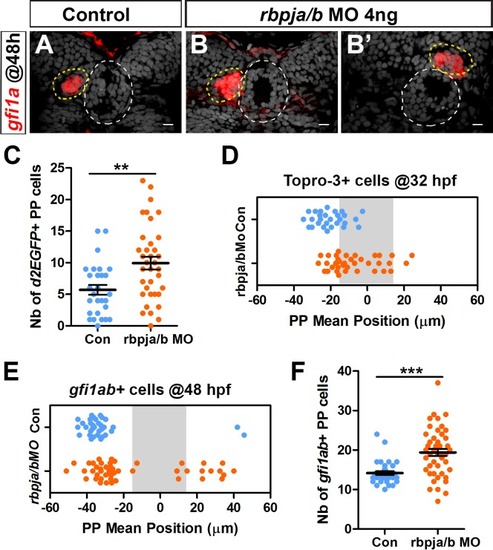
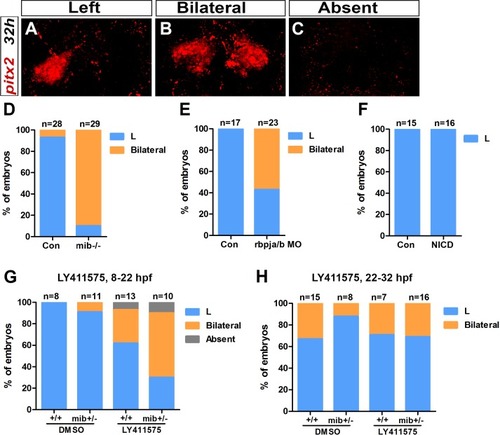
rbpja/b morphants phenocopy mindbomb mutants. (A–B’) Confocal sections showing the expression of gfi1ab (red) at 48 hpf in control embryos (A, n = 33) and in two representative embryos injected with 4 ng of rbpja/b morpholinos (MO) (B, B’); sections are merged with nuclear staining (gray) to highlight the epiphysis (white circle) and parapineal (yellow circle). Embryo view is dorsal, anterior is up; scale bar = 10 µm. (C–D) Dot plots showing the number of Tg(dusp6:d2EGFP) positive parapineal cells (C) and the mean position of parapineal cells highlighted by nuclei staining (Topro-3) (D) at 32 hpf in embryos injected with 4 ng rbpja/b MO (orange dots; n = 36) or in controls (blue dots; n = 28). (E–F) Dot plots showing the mean position (E) or the number (F) of gfi1ab expressing parapineal cells in non-injected controls (blue dots, n = 33) or in rbpja/b MO injected embryos (orange dots, n = 46) at 48 hpf. Both the migration (distance from the midline; p-value=0.0001 in Welch t-test on absolute value) and laterality (left orientation of migration; p-value=0.0002 on Wilcoxon test) are affected in rbpja/b morphants (E). The number of gfi1ab+ cells is also increased in rbpja/b morphants (F, *** p-value<0.0001; Welch t-test). Data are representative of three (A–B’, E–F) or two experiments (C–D).

Components of the Notch pathway are mosaically expressed in the parapineal.

(A–B) Confocal sections showing the expression of Tg(Tp1bglob:EGFP) transgene (green, A, B), Topro-3 nuclear staining (gray, A’–B’) and merge (A’’–B’’) in the epithalamia of two embryos at 30 hpf (n = 3/19). Notch reporter transgene is strongly expressed in the epiphysis (white circle) and weakly detected in the parapineal (yellow circle) of few embryos (n = 3/19). Embryo view is dorsal, anterior is up; scale bar = 10 µm. Data corresponds to three experiments. (C–D’’) Confocal sections showing the expression of Tg(dusp6:d2EGFP) transgene (green, C, D) and deltaB (red, C’–D’) and merge (C’’–D’’) in the epithalamia of two representative embryos at 32 hpf. deltaB mRNA is detected in only one or two parapineal cells in most embryos (n = 17/23); staining is either co-expressed with Tg(dusp6:d2EGFP) (n = 11/23) or detected in Tg(dusp6:d2EGFP) negative cells (n = 6/23); in n = 6/23, deltaB was not detected in the parapineal. Embryo view is dorsal, anterior is up; epiphysis (white circle), parapineal (yellow circle); scale bar = 10 µm. Data are representative of two experiments.

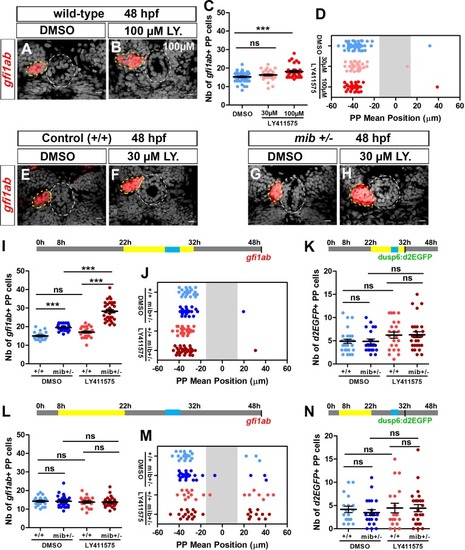
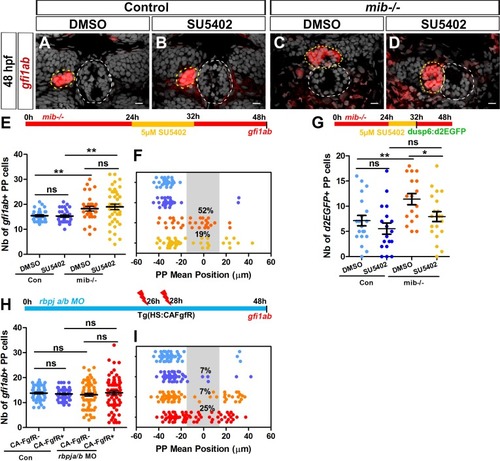
(A–B) Confocal sections showing the expression of gfi1ab (red) in embryos treated with DMSO (A; n = 24) or 100 µM LY411575 (B; n = 32) from 22 to 32 hpf and fixed at 48 hpf, merged with nuclear staining (gray). Embryo view is dorsal, anterior is up; epiphysis (white circle) and parapineal (yellow circle); scale bar = 10 µm. (C–D) Dot plots showing the number (C) and the mean position (D) of gfi1ab expressing parapineal (PP) cells at 48 hpf in embryos treated with DMSO (controls, blue dots, n = 47), with 30 µM LY411575 (light red dots, n = 31) or 100 µM LY411575 (red dots, n = 32) from 22 hpf to 32 hpf, with mean ± SEM; *** p-value=0.0003. (E–H) Confocal sections showing the expression of gfi1ab (red) merged with nuclear staining (gray) at 48 hpf, in wild-type (+/+) (E, F) or mib+/- embryos (G, H) treated with DMSO (E, n = 23 or G, n = 26) or with LY411575 (F, n = 25 and H, n = 34) from 22 to 32 hpf. (I–N) Upper panels show a schematic of the LY411575 treatment timeline (yellow box, 22 to 32 hpf for I-K or 8 to 22 hfp for dot plots L-N), and the time window corresponding to when the parapineal initiates its migration (blue box, 28 to 30 hpf). Dot plots showing the number (I, L) and the mean position (J, M) of gfi1ab expressing cells at 48 hpf, or the number of Tg(dusp6:d2EGFP) expressing cells at 32 hpf (K, N), in the parapineal of DMSO-treated wild-type (+/+, light blue dots; I-J, n = 23; L-M, n = 12; K, n = 28; N, n = 18), DMSO-treated mib+/- heterozygote (dark blue dots; I-J, ± = 26; L-M, n = 17; K, n = 21; N, n = 21), LY411575-treated wild-type ( light red dots; I-J, n = 25; L-M, n = 11; K, n = 23, N, n = 19) and LY411575-treated mib+/- (dark red dots, I-J, n = 34 or L-M, n = 16; K, n = 29, N, n = 26); each dot represents a single embryo. Mean ± SEM is shown in I, K, L, N; *** p-value<0.0001, in Wilcoxon test and Welch t-test. In J and M, there is no defect in migration per se (ns p-value in Welch t-test on absolute value) but LY411575 treatment from 8 to 22 hpf (M) triggers a laterality defect (increased number of embryos with a parapineal on the right). Data are representative of three (E–H, I–K) or two experiments (A–D and L–N).

Early Notch loss-of-function results in bilateral Nodal pathway activation in the epithalamus.

(A–C) Confocal sections showing Left (A), Bilateral (B) or Absent (C) pitx2c expression in the epithalamus at 32 hpf (red). Embryo view is dorsal, anterior is up; scale bar = 10 µm. (D–H) Histogram showing the percentage of embryos with Left (L, blue), Bilateral (orange) and Absent (gray) pitx2c expression in mib-/- mutant embryos (D), in rbpja/b morphant (MO) embryos (E), in embryos expressing NICD (Notch Intra-cellular Domain) (F) and in embryos treated with 30 µM of LY411575 from 8 to 22 hpf (G) or from 22 to 32 hpf (H). Genetic background, treatment and embryos numbers are indicated below each bar; Con: control sibling embryos. Data are representative of two (D–F) or one experiment (E, G, H).

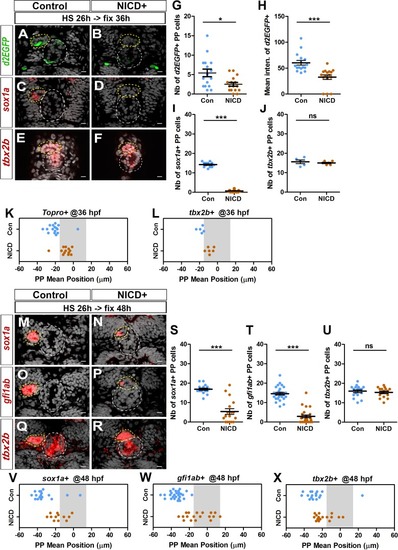
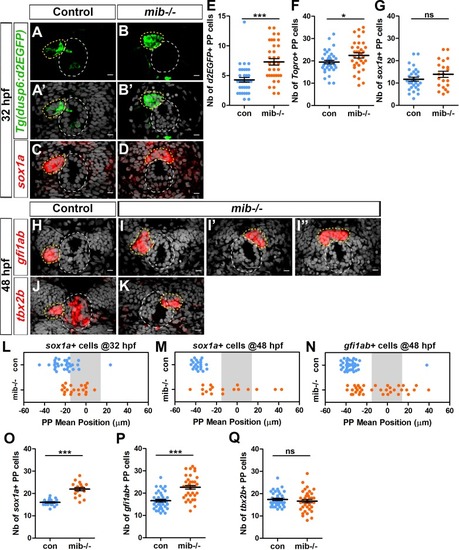
(A–F) Confocal sections showing the expression of Tg(dusp6 :d2EGFP) (A-B, green), sox1a (C-D, red) or tbx2b (E-F, red) at 36 hpf, in control embryos (A, n = 16; C, n = 12; E, n = 5) or in Tg(hsp70l:Gal4), Tg(UAS:myc-notch1a-intra) embryos (B, n = 16; D, n = 17; F, n = 6) following a heat-shock (HS) at 26 hpf; sections are merged with nuclei staining (gray). (G–L) Dot plots showing the number (G) and the mean intensity fluorescence (H) of Tg(dusp6 :d2EGFP) expressing parapineal cells, the number of sox1a (I) and tbx2b (J) expressing parapineal cells, or the mean position of parapineal cells highlighted by Topro-3 nuclei staining (K) and tbx2b + parapineal cells (L) in controls (blue dots) or in NICD expressing embryos (orange dots) at 36 hpf following heat shock at 26 hpf. (M–R) Confocal sections showing the expression of sox1a (M–N), gfi1ab (O–P) or tbx2b (Q–R) (red) merged with nuclei staining (gray), at 48 hpf, in the epithalamia of control (M, n = 17; O, n = 27; Q, n = 17) or Tg(hsp70l:Gal4);Tg(UAS:myc-notch1a-intra) double transgenic embryos (N, n = 17; P, n = 25; R, n = 16), following heat-shock (HS) at 26 hpf. The expression of sox1a and gfi1ab is lost or decreased while tbx2b expression is unchanged in the parapineal of NICD expressing embryos. (S–X) Dot plots showing the number of sox1a (S), gfi1ab (T) and tbx2b (U) expressing parapineal cells at 48 hpf in controls (blue dots) or in embryos expressing NICD after heat shock at 26 hpf (orange dots) and the corresponding mean position of the cells (V–X) when expression was detected (number of sox1a + or gfi1ab+ cells > 0). In confocal sections, embryo view is dorsal, anterior is up; epiphysis (white circle) and parapineal gland (yellow circle); scale bar = 10 µm. Mean ± SEM is indicated on dot plots G-J and S-U; *** p-value<0.0001, * p-value<0.05 in Welch t-test and Wilcoxon test. For migration dot plots, p-value<0.01 (L) or p-value<0.001 (K and V–X) in pairwise Wilcoxon test and Welch t-test on absolute values. Data are representative of three (O, P, T, W) or two experiments (A–D, G–I, M–N, Q–R, S, U, V, X); data based on tbx2b expression at 36 hpf (E–F, J, L) represents one experiment.

Decreasing or increasing FGF signaling rescues or aggravates the parapineal migration defect in Notch loss-of-function.

(A–D) Confocal sections showing the expression of gfi1ab (red) merged with nuclei staining (gray) at 48 hpf in representative control sibling (A–B) or mib-/- mutant embryos (C–D) treated from 24 to 32 hpf with DMSO (A, C) or 5 µM SU5402 (B, D). Parapineal migration is not affected in controls embryos treated with 5 µM of SU5402 (A–B); in C-D, examples show a parapineal that failed to migrate in a DMSO treated mib-/- mutant embryos (C) or that migrated to the left in a SU5402 treated mib-/- mutant embryos (D). Embryo view is dorsal, anterior is up; epiphysis (white circle) and parapineal (yellow circle); scale bar = 10 µm. (E–F) Upper panel show a schematic of the SU5402 (or DMSO) treatment timeline (24–32 hpf) in control and mib-/- mutant embryos. Dot plots showing the number (E) and the mean position (F) of gfi1ab expressing parapineal (PP) cells at 48 hpf in control embryos treated with DMSO (light blue dots; n = 32) or with 5 µM SU5402 (dark blue dots, n = 31), and in mib-/- mutant embryos treated with DMSO (orange dots, n = 31) or with SU5402 (yellow dots, n = 41). The number of gfi1ab-positive cells is increased in mib-/- mutants embryos, regardless of whether they were treated with SU5402 or DMSO (DMSO control versus DMSO mib-/-, ** p-value=0.0042; SU5402 control versus SU5402 mib-/-, ** p-value=0.0086, Welch t-test). The parapineal fails to migrate in 52% of DMSO treated mib-/- mutant embryos (PP mean position between −15 µm to +15 µm, gray-shaded area), and this proportion decreases to 19% of SU5402 treated mib-/- mutant embryos; p-value=0.0139 on a Chi-square test and p=0.0103 on a Welch t-test on absolute value. (G) Upper panel shows a schematic of the SU5402 (or DMSO) treatment timeline (24–32 hpf) in control and mib-/- mutant embryos. Dot plot showing the number of Tg(dusp6:d2EGFP) expressing parapineal cells at 32 hpf in control embryos treated with DMSO (light blue; n = 20) or with 5 µM SU5402 (dark blue, n = 18), and in mib-/- mutant embryos treated with DMSO (orange, n = 17) or with SU5402 (yellow, n = 21). The number of Tg(dusp6:d2EGFP)+ cells is increased in DMSO treated mib-/- mutants versus controls (p-value=0.0077) but is decreased in SU5402 treated mib-/- mutants compared to DMSO treated mib-/- mutants (p-value=0.0248 in Welch’s t-test). (H–I) Upper panel in H shows a schematic of heat shock timeline in Tg(hsp70:ca-fgfr1) embryos injected with rbpja/b morpholinos (MO). Dot plots showing the number (H) and the mean position (I) of gfi1ab expressing parapineal cells in control embryos that carry (purple dots; n = 55) or do not carry the Tg(hsp70:ca-fgfr1) transgene (light blue dots; n = 54), or in rbpja/bMO injected embryos that carry (dark red dots; n = 73) or do not carry the Tg(hsp70:ca-fgfr1) transgene (orange dots; n = 67). In rbpja/b morphants expressing Tg(hsp70:ca-fgfr1), the parapineal failed to migrate in 25% of embryos (n = 18/73; p-value=0.0007 Welch’s t-test on absolute value and p-value=0.0232 in Chi-square test), a defect significantly higher than expected from merely adding the effects of activated receptor transgene and rbpja/b MO injections alone (p-value=0.0001 in Welch t-test on absolute value and p-value=0.0003 in Chi-square test). Data are representative of four (H–I), three (A–F) or two experiments (G). Source files used to generate dot plots and for statistical analysis are available in Figure 4—source data 1.

10.7554/eLife.46275.017

Source files for data used to generate dot plots in <xref rid='fig4' ref-type='fig'>Figure 4</xref>.

Acknowledgments
This image is the copyrighted work of the attributed author or publisher, and ZFIN has permission only to display this image to its users. Additional permissions should be obtained from the applicable author or publisher of the image. Full text @ Elife