
Figure 3 Supplement 1
- ID
- ZDB-FIG-191230-1652
- Publication
- Wei et al., 2019 - Notch signaling restricts FGF pathway activation in parapineal cells to promote their collective migration
- Other Figures
- All Figure Page
- Back to All Figure Page
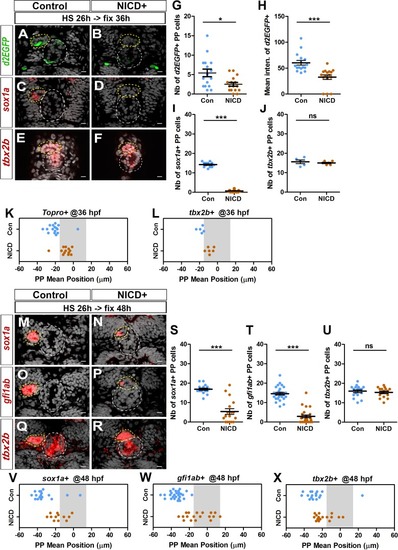
(A–F) Confocal sections showing the expression of Tg(dusp6 :d2EGFP) (A-B, green), sox1a (C-D, red) or tbx2b (E-F, red) at 36 hpf, in control embryos (A, n = 16; C, n = 12; E, n = 5) or in Tg(hsp70l:Gal4), Tg(UAS:myc-notch1a-intra) embryos (B, n = 16; D, n = 17; F, n = 6) following a heat-shock (HS) at 26 hpf; sections are merged with nuclei staining (gray). (G–L) Dot plots showing the number (G) and the mean intensity fluorescence (H) of Tg(dusp6 :d2EGFP) expressing parapineal cells, the number of sox1a (I) and tbx2b (J) expressing parapineal cells, or the mean position of parapineal cells highlighted by Topro-3 nuclei staining (K) and tbx2b + parapineal cells (L) in controls (blue dots) or in NICD expressing embryos (orange dots) at 36 hpf following heat shock at 26 hpf. (M–R) Confocal sections showing the expression of sox1a (M–N), gfi1ab (O–P) or tbx2b (Q–R) (red) merged with nuclei staining (gray), at 48 hpf, in the epithalamia of control (M, n = 17; O, n = 27; Q, n = 17) or Tg(hsp70l:Gal4);Tg(UAS:myc-notch1a-intra) double transgenic embryos (N, n = 17; P, n = 25; R, n = 16), following heat-shock (HS) at 26 hpf. The expression of sox1a and gfi1ab is lost or decreased while tbx2b expression is unchanged in the parapineal of NICD expressing embryos. (S–X) Dot plots showing the number of sox1a (S), gfi1ab (T) and tbx2b (U) expressing parapineal cells at 48 hpf in controls (blue dots) or in embryos expressing NICD after heat shock at 26 hpf (orange dots) and the corresponding mean position of the cells (V–X) when expression was detected (number of sox1a + or gfi1ab+ cells > 0). In confocal sections, embryo view is dorsal, anterior is up; epiphysis (white circle) and parapineal gland (yellow circle); scale bar = 10 µm. Mean ± SEM is indicated on dot plots G-J and S-U; *** p-value<0.0001, * p-value<0.05 in Welch t-test and Wilcoxon test. For migration dot plots, p-value<0.01 (L) or p-value<0.001 (K and V–X) in pairwise Wilcoxon test and Welch t-test on absolute values. Data are representative of three (O, P, T, W) or two experiments (A–D, G–I, M–N, Q–R, S, U, V, X); data based on tbx2b expression at 36 hpf (E–F, J, L) represents one experiment. |