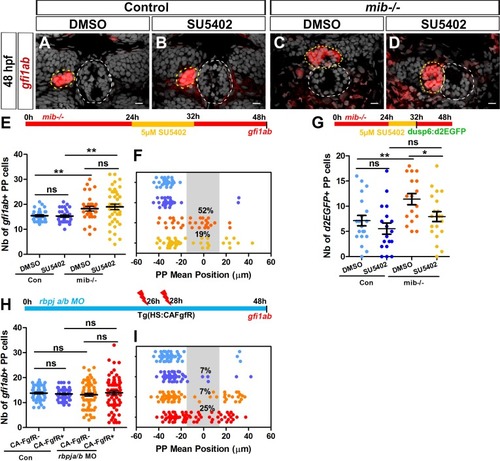
Decreasing or increasing FGF signaling rescues or aggravates the parapineal migration defect in Notch loss-of-function.
(A–D) Confocal sections showing the expression of gfi1ab (red) merged with nuclei staining (gray) at 48 hpf in representative control sibling (A–B) or mib-/- mutant embryos (C–D) treated from 24 to 32 hpf with DMSO (A, C) or 5 µM SU5402 (B, D). Parapineal migration is not affected in controls embryos treated with 5 µM of SU5402 (A–B); in C-D, examples show a parapineal that failed to migrate in a DMSO treated mib-/- mutant embryos (C) or that migrated to the left in a SU5402 treated mib-/- mutant embryos (D). Embryo view is dorsal, anterior is up; epiphysis (white circle) and parapineal (yellow circle); scale bar = 10 µm. (E–F) Upper panel show a schematic of the SU5402 (or DMSO) treatment timeline (24–32 hpf) in control and mib-/- mutant embryos. Dot plots showing the number (E) and the mean position (F) of gfi1ab expressing parapineal (PP) cells at 48 hpf in control embryos treated with DMSO (light blue dots; n = 32) or with 5 µM SU5402 (dark blue dots, n = 31), and in mib-/- mutant embryos treated with DMSO (orange dots, n = 31) or with SU5402 (yellow dots, n = 41). The number of gfi1ab-positive cells is increased in mib-/- mutants embryos, regardless of whether they were treated with SU5402 or DMSO (DMSO control versus DMSO mib-/-, ** p-value=0.0042; SU5402 control versus SU5402 mib-/-, ** p-value=0.0086, Welch t-test). The parapineal fails to migrate in 52% of DMSO treated mib-/- mutant embryos (PP mean position between −15 µm to +15 µm, gray-shaded area), and this proportion decreases to 19% of SU5402 treated mib-/- mutant embryos; p-value=0.0139 on a Chi-square test and p=0.0103 on a Welch t-test on absolute value. (G) Upper panel shows a schematic of the SU5402 (or DMSO) treatment timeline (24–32 hpf) in control and mib-/- mutant embryos. Dot plot showing the number of Tg(dusp6:d2EGFP) expressing parapineal cells at 32 hpf in control embryos treated with DMSO (light blue; n = 20) or with 5 µM SU5402 (dark blue, n = 18), and in mib-/- mutant embryos treated with DMSO (orange, n = 17) or with SU5402 (yellow, n = 21). The number of Tg(dusp6:d2EGFP)+ cells is increased in DMSO treated mib-/- mutants versus controls (p-value=0.0077) but is decreased in SU5402 treated mib-/- mutants compared to DMSO treated mib-/- mutants (p-value=0.0248 in Welch’s t-test). (H–I) Upper panel in H shows a schematic of heat shock timeline in Tg(hsp70:ca-fgfr1) embryos injected with rbpja/b morpholinos (MO). Dot plots showing the number (H) and the mean position (I) of gfi1ab expressing parapineal cells in control embryos that carry (purple dots; n = 55) or do not carry the Tg(hsp70:ca-fgfr1) transgene (light blue dots; n = 54), or in rbpja/bMO injected embryos that carry (dark red dots; n = 73) or do not carry the Tg(hsp70:ca-fgfr1) transgene (orange dots; n = 67). In rbpja/b morphants expressing Tg(hsp70:ca-fgfr1), the parapineal failed to migrate in 25% of embryos (n = 18/73; p-value=0.0007 Welch’s t-test on absolute value and p-value=0.0232 in Chi-square test), a defect significantly higher than expected from merely adding the effects of activated receptor transgene and rbpja/b MO injections alone (p-value=0.0001 in Welch t-test on absolute value and p-value=0.0003 in Chi-square test). Data are representative of four (H–I), three (A–F) or two experiments (G). Source files used to generate dot plots and for statistical analysis are available in Figure 4—source data 1.
10.7554/eLife.46275.017
Source files for data used to generate dot plots in <xref rid='fig4' ref-type='fig'>Figure 4</xref>.
Expression Data
Expression Detail
Antibody Labeling
Phenotype Data
Phenotype Detail
Acknowledgments
This image is the copyrighted work of the attributed author or publisher, and
ZFIN has permission only to display this image to its users.
Additional permissions should be obtained from the applicable author or publisher of the image.
Full text @ Elife
Your Input Welcome
Thank you for submitting comments. Your input has been emailed to ZFIN curators who may contact you if
additional information is required.
Oops. Something went wrong. Please try again later.