
- Title
-
Zebrafish model of KRAS-initiated pancreatic endocrine tumor
- Authors
- Oh, S., Park, J.T.
- Source
- Full text @ Animal Cells Syst (Seoul)

Generation of |
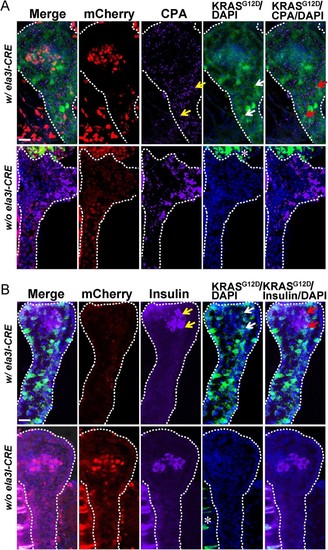
Early EXPRESSION / LABELING:
|

Identification of pancreatic tumors in PHENOTYPE:
|

Histological profiles of the abnormal pancreatic region at 6 and 12 months of age. (A–C) Histological examination showed that acinar structure of pancreas (black arrows, zymogen granules in cytoplasm) is disrupted by expansion of populations of poorly differentiated round cells that resemble islet cells (blue arrows). Boxed areas indicate regions depicted at higher magnification in adjacent images. Scale bars: 50 μm. (D and E) GFP and PCNA staining in the abnormal pancreatic region. GFP and PCNA staining was observed in the poorly differentiated cells. Boxed areas indicate regions depicted at higher magnification in adjacent images. Scale bars: 50 μm. (F) In the control group (w/o |
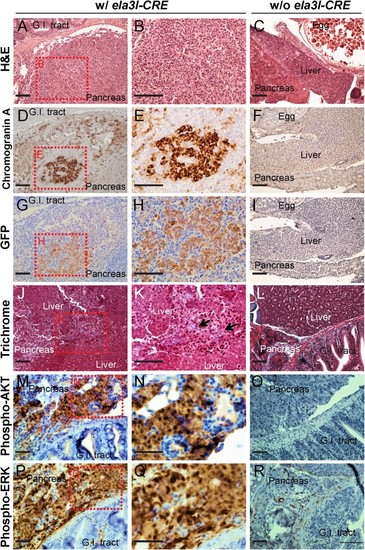
Immunohistochemical profiles of the abnormal pancreatic region at 6 and 12 months of age. (A–C) Histological profiles in |
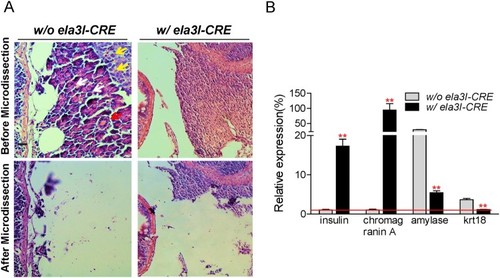
Molecular characterization of pancreatic tumors at 6 and 12 months of age. (A) To further classify the origin of pancreatic tumors, microdissection was performed. As a control, the pancreas region from the age-matched adult fish in the control group (w/o |