IMAGE

Figure 5.

ID
ZDB-IMAGE-190723-681
Genes
Antibodies
Source
Figures for Oh et al., 2019
Image
Figure Caption

Figure 5.

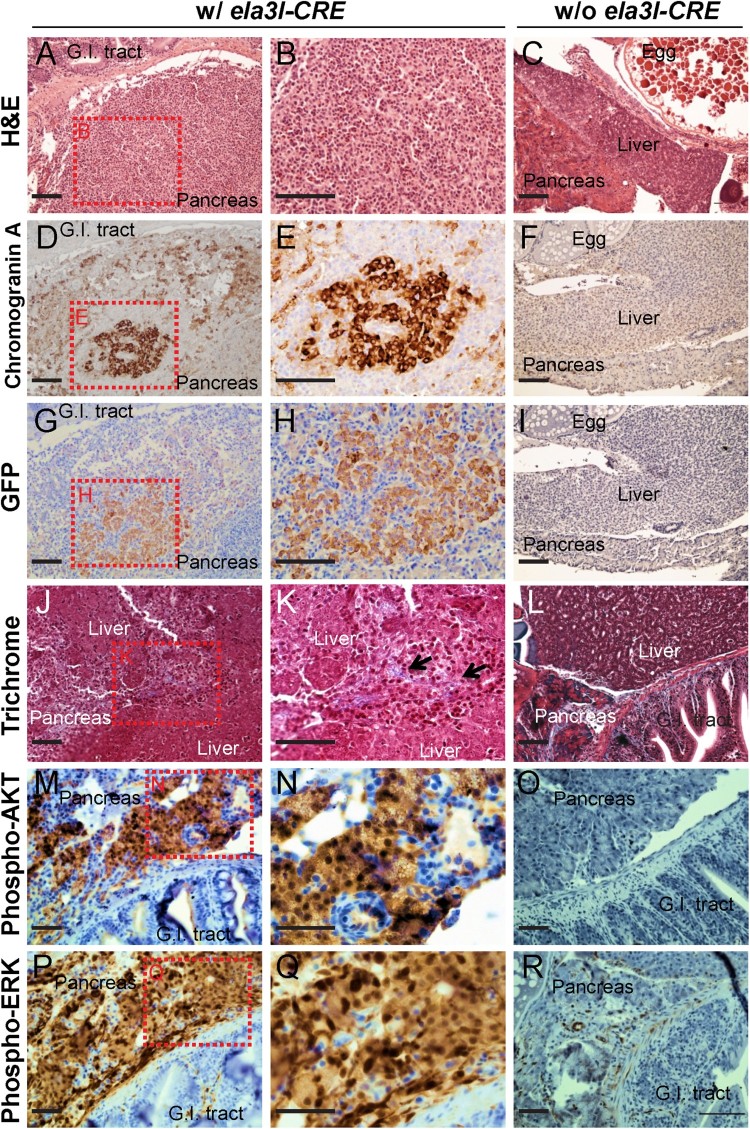
Immunohistochemical profiles of the abnormal pancreatic region at 6 and 12 months of age. (A–C) Histological profiles in Tg (ela3I-CRE; LSL-KRASG12D) fish (A and B). Boxed areas indicate regions depicted at higher magnification in adjacent images. In the control group (w/o ela3I-CRE), normal histology was observed (C). Scale bars: 50 μm. (D–F) Enhanced chromogranin A staining was observed in the KRASG12D-induced pancreatic tumor (D and E), whereas infrequent chromogranin A staining was observed in the endocrine region of the pancreas in the control group (w/o ela3I-CRE) (F). Scale bars: 50 μm. (G–I) The chromogranin A-positive tissues were also positive for GFP staining (G and H), whereas no GFP staining was observed in the control group (w/o ela3I-CRE). Scale bars: 50 μm. (J–L) Trichrome staining to identify the regions of fibrosis and sclerosis. The blue collagen fibers (black arrows) demonstrated that the invading carcinoma triggered fibrosis/sclerosis (J and K). In the control group (w/o ela3I-CRE), typical fibrotic changes were observed in the pancreas (L). Scale bars: 50 μm. (M–R) KRASG12D-induced pancreatic tumors showed widespread labeling for both phospho-AKT (M and N) and phospho-ERK (P and Q), in contrast to infrequent AKT and ERK phosphorylation in controls (w/o ela3I-CRE) (O and R). Scale bar: 50 µm.

Figure Data
Acknowledgments
This image is the copyrighted work of the attributed author or publisher, and ZFIN has permission only to display this image to its users. Additional permissions should be obtained from the applicable author or publisher of the image. Full text @ Animal Cells Syst (Seoul)