IMAGE

Figure 3.

ID
ZDB-IMAGE-210518-11
Source
Figures for Oh et al., 2019
Image
Figure Caption

Figure 3.

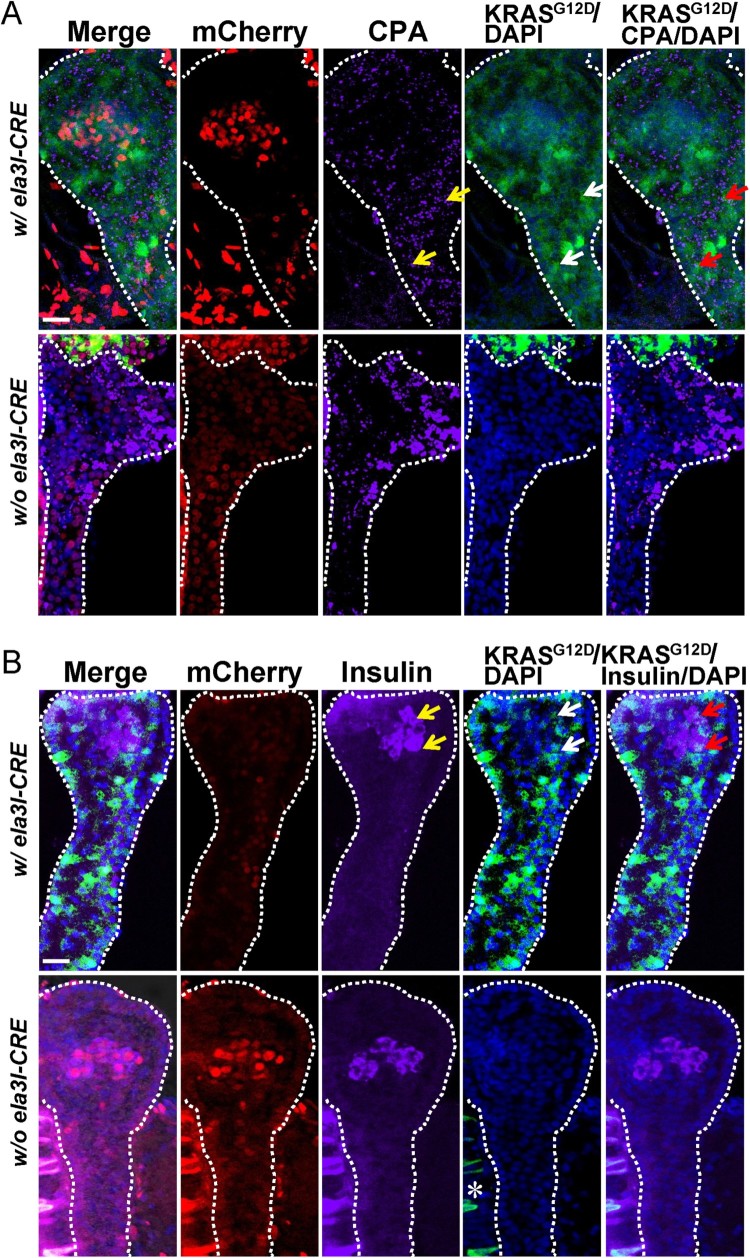
Identification of pancreatic tumors in Tg (ela3I-CRE; LSL-KRASG12D) fish. (A and B) Transcutaneous fluorescence in the abdomen of Tg (ela3I-CRE; LSL-KRASG12D) fish (A) and dissected abdominal viscera with a GFP-positive tumor in pancreas (B). (C and D) In the control group (w/o ela3I-CRE), no fluorescence was detected in the abdomen (C) and the dissected abdominal viscera (D). The dotted line indicated the pancreatic region. Scale bar: 2 mm. (E) Quantification of GFP-positive pancreatic tumor frequency in Tg (ela3I-CRE; LSL-KRASG12D) fish. A random subset of fish was anesthetized periodically at 3 (n = 10), 6 (n = 10), and 12 months (n = 10).

Figure Data
Acknowledgments
This image is the copyrighted work of the attributed author or publisher, and ZFIN has permission only to display this image to its users. Additional permissions should be obtained from the applicable author or publisher of the image. Full text @ Animal Cells Syst (Seoul)