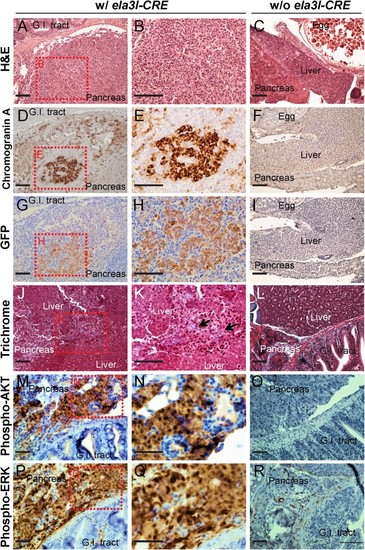
Immunohistochemical profiles of the abnormal pancreatic region at 6 and 12 months of age. (A–C) Histological profiles in Tg (ela3I-CRE; LSL-KRASG12D) fish (A and B). Boxed areas indicate regions depicted at higher magnification in adjacent images. In the control group (w/o ela3I-CRE), normal histology was observed (C). Scale bars: 50 μm. (D–F) Enhanced chromogranin A staining was observed in the KRASG12D-induced pancreatic tumor (D and E), whereas infrequent chromogranin A staining was observed in the endocrine region of the pancreas in the control group (w/o ela3I-CRE) (F). Scale bars: 50 μm. (G–I) The chromogranin A-positive tissues were also positive for GFP staining (G and H), whereas no GFP staining was observed in the control group (w/o ela3I-CRE). Scale bars: 50 μm. (J–L) Trichrome staining to identify the regions of fibrosis and sclerosis. The blue collagen fibers (black arrows) demonstrated that the invading carcinoma triggered fibrosis/sclerosis (J and K). In the control group (w/o ela3I-CRE), typical fibrotic changes were observed in the pancreas (L). Scale bars: 50 μm. (M–R) KRASG12D-induced pancreatic tumors showed widespread labeling for both phospho-AKT (M and N) and phospho-ERK (P and Q), in contrast to infrequent AKT and ERK phosphorylation in controls (w/o ela3I-CRE) (O and R). Scale bar: 50 µm.
|
