
- Title
-
Moderate Nucleoporin 133 deficiency leads to glomerular damage in zebrafish
- Authors
- Cianciolo Cosentino, C., Berto, A., Pelletier, S., Hari, M., Loffing, J., Neuhauss, S.C.F., Doye, V.
- Source
- Full text @ Sci. Rep.

Expression of nup133 in the developing zebrafish detected by in situ hybridization (ISH). Whole mount ISH with nup133 antisense probe of embryos at: (a) sphere stage (4 hpf; embryo shown with animal pole to the top); (b) 24 hfp (lateral view); (c–f) 3 and 5 dpf (left panels: dorsal view; right panels: lateral view). Arrows point to tissues with enriched expression of nup133. Abbreviations: E: eyes; T: tectum; C: cerebellum; L: liver; I: intestine; N: neuromasts; SB: swim bladder. Scale bars, 200 μm. (g) Transverse section of a 5 dpf embryo at the level of the pectoral fins (as shown in the dotted line in e) confirms nup133 expression in the liver, and show in addition a diffuse staining in the proximal tubules (PT) and a faint signal in the glomerulus (G). Scale bar, 50 μm. |

ZFIN is incorporating published figure images and captions as part of an ongoing project. Figures from some publications have not yet been curated, or are not available for display because of copyright restrictions. |

Partial knockdown of nup133 causes glomerular expansion in zebrafish. (a) Gross morphology of 3 dpf control and nup133 MO embryos (left panels: lateral view; middle panel: dorso-lateral view from two distinct embryos). Scale bar, 500 μm. Two-fold magnification of the indicated area is shown in the rightmost panels. Arrows indicate the pronephric cysts detected in the nup133 MO embryos. (b) Dorsal view of 3dpf Tg(wt1b:EGFP) embryos uninjected (control, top panels), injected with nup133 MO (middle panels), or sequentially injected with 3xHA-mCherry-Dr nup133 mRNA (wt mRNA) and nup133 MO (bottom panels). Overlays of transmission (gray) and GFP-signal (green) images reveal the glomerulus, proximal tubules, and exocrine pancreas. Scale bar, 500 μm. Two-fold magnification of the indicated area and of the same area from a distinct larvae are shown in the right and rightmost panels, respectively. The glomerular structure is indicated in brackets. Asterisks point to cystic dilations of the pronephros in nup133 MO (middle panels). Note that the nup133 MO + wt mRNA embryo displays a left-sided exocrine pancreas (arrowhead) (see also Supplemental Fig. S5). (c) Relative proportion of embryos showing or not kidney cysts at 3 dpf. For each condition, the total number of embryos analyzed is indicated (n=, quantified in 2 distinct experiments for control MO injections and 5 experiments for nup133 MO injections. See also Supplementary Fig. S3). Unlike the embryos injected with control MO, those injected with nup133 MO frequently feature kidney cysts. On the other hand nup133 MO + wt mRNA showed significantly fewer cysts than nup133 MO alone. ***P < 0.0001 using a Fisher exact probability test EXPRESSION / LABELING:
PHENOTYPE:
|
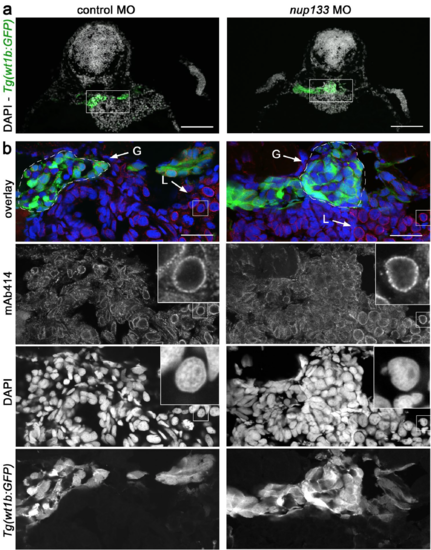
Nup133 depletion does not result in major nuclear pore complex assembly defects. (a) Representative transverse sections of the glomerulus of 3 dpf Tg(wt1b:EGFP) embryos treated with either control or nup133 morpholinos (MO) and stained with mAb414 (not shown in these panels) and DAPI. In these sections, GFPpositive cells mark the glomerulus and the neck region of the proximal tubules. Scale bars, 100 μm. (b) Fivefold magnification of the areas indicated in (a) encompassing the glomerulus (G, indicated by the dashed lines) and the liver (L). mAb414 antibody, that recognizes a subset of FG-nucleoporins, shows specific staining around the nucleus of all cells (visualized with DAPI), with however cell-type-dependent variations in intensity. Note for instance the more prominent staining of liver as compared to glomerular cells. In contrast, no major difference can be seen between control and nup133 MO-treated embryos. Insets show a fourfold magnification of representative liver nuclei, revealing the punctate staining typical of NPC staining (mAb414). EXPRESSION / LABELING:
|

Normal development of the pronephric tubules and glomerulus in nup133 morphants. (a) Lateral view of pax2a mRNA expression in pronephric tubules at 24 hpf in uninjected (control) and nup133 MOinjected embryos reveal that the developmental expression of pax2a is not altered in nup133 morphants. Twofold magnification of the pronephric tubules is also shown. (b) Pronephros marker cdh17 mRNA expression in nup133 MO is comparable to that of uninjected controls at 24 and 72 hpf (dorsal view). (c) Glomerular development in control and nup133 MO embryos visualized using the podocyte differentiation marker wt1a (dorsal view). At 30 hpf (upper panels), wt1a marks future podocytes with two distinct domains in both control and nup133 MO. At 48 hpf (middle panels), the glomerular primordia merge to the midline to form a single glomerulus. At these stages, mRNA expression does not differ between control and nup133 MO (middle panels). At 58 hpf (lower panels), after the onset of glomerular filtration, the increased area labeled by the wt1a probe (arrow) reflects the glomerular expansion observed in 7 out of 13 nup133 morphants analyzed. Scale bars, 500 μm. EXPRESSION / LABELING:
PHENOTYPE:
|

Glomerular filtration is impaired in nup133 morphants. Representative images of cross sections of 4 dpf control (left panels) and nup133 morphants larvae (right panels) fixed 20 minutes after injection of Alexa Fluor™ 647 conjugated-BSA into the common cardinal vein. Lower panels represent a higher magnification view of the proximal tubule region (dotted lines). Note the uptake of fluorescent BSA in the apical endosomes of the proximal tubules of the Nup133-depleted larva (arrows). Scale bars 50 µm. PHENOTYPE:
|
|
ZFIN is incorporating published figure images and captions as part of an ongoing project. Figures from some publications have not yet been curated, or are not available for display because of copyright restrictions. PHENOTYPE:
|
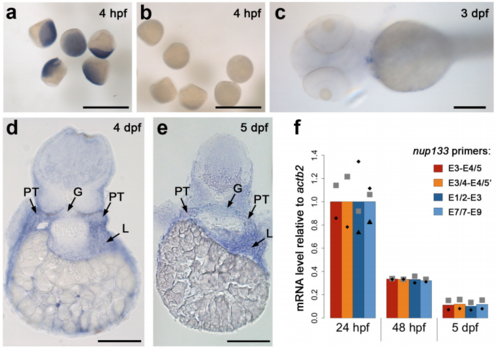
Analysis of nup133 expression in zebrafish embryos by in situ mRNA hybridization (ISH) and quantitative RT-PCR (RT-qPCR). Zebrafish embryos were hybridized with antisense (a, d, e) or sense (b, c) nup133 mRNA probes. Whole mount ISH at sphere stage (a, b, scale bars 1 mm) and 3 dpf (c, scale bar 200 µm), and transverse sections of 4 and 5 dpf embryo at the level of the pectoral fins (d, e, scale bars, 100 µm) are presented. (f) nup133 mRNA levels relative to actb2 expression was determined by RT-qPCR on 24 hpf, 48 hpf and 5 dpf embryos using 4 distinct primer pairs (listed in Supplementary Table S1 and positioned above the scheme of nup133 exon structure in Figure 2a). For each pair of primers, the mean of 2-3 distinct experiments (each represented by a distinct symbol) was set to 1 at 24 hpf. |

Retention of intron 3 in nup133 MO injected embryos and morphology of 3 and 5 dpf control and nup133 MO larvae. (a) Exon structure of Danio rerio (Dr) nup133 around the binding sites of the E3I3 and I3E4 splice morpholinos. The size of intron 3 is indicated. Sequencing of the additional RT-PCR product in the nup133MO embryos shows retention of intron 3. The end of the predicted aa sequence of the corresponding truncated protein is indicated in red, under the DNA sequence. Residues encoded by the intron are underlined. (b) Extracts from 24 hpf control and nup133 MO embryos were analyzed by western blot using anti-Nup133 and anti ß-actin antibodies (used as loading control). Dilutions of the control samples (1:2 and 1:4) were also loaded to better appreciate the decrease of Nup133 protein level. (c) Relative proportions of 3dpf embryos with kidney cysts or dead upon injection of the indicated amounts of control or of each nup133 MO. For each condition, the total number of embryos analyzed is indicated (n=). (d) Gross morphology of 3 dpf control and nup133 MO larvae. Note the pericardial edema in nup133 MO larvae (arrow). (e) Toluidine blue stained sections of 5 dpf uninjected control (left panel) and nup133 MO injected larvae (right panel) showing the glomerulus and the proximal tubules (indicated with dotted lines). Note the cystic dilation of the glomerulus in the nup133 MO larvae that is not associated with a major dilatation of the proximal tubules. Scale bars 50 µm. |
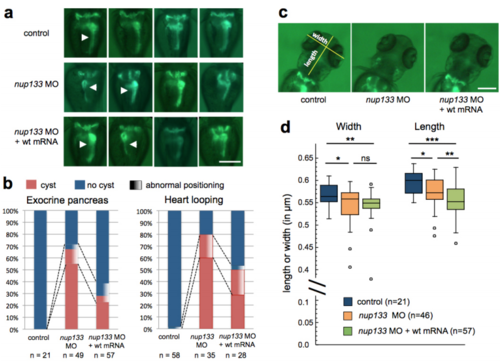
Unlike the appearance of kidney cysts, the Left-Right patterning defects and the mild alteration of head size observed in nup133 morphants are not rescued by wt nup133 mRNA. (a, c) Dorsal view of (a) the bodies and (c) the heads of 3dpf Tg(wt1b:EGFP) embryos injected with control or nup133 MO, or sequentially injected with 3xHA-mCherry-Dr nup133 mRNA and nup133 MO (nup133 MO + wt mRNA). Overlays of transmission and GFP-signal images are presented. In (a), arrowheads point to the exocrine pancreas that is located on the right side of control larvae, but is sometimes misplaced towards the left side in nup133 MO injected embryos, injected or not with 3xHA-mCherry-Dr nup133 mRNA. (b) The presence of glomerular cysts and either the abnormal positioning of the exocrine pancreas (left panel) or heart looping (right panel) were recorded on the indicated number of 3 dpf and 2 dpf larvae, respectively. The exocrine pancreas was scored as normal, when positioned to the right and as "abnormal positioning" when positioned to the left or in the midline. Heart looping was scored as normal if the ventricle was on the right of the atrium (D-looping), and as "abnormal positioning" if the ventricle was either on the left of the atrium (L loop) or if it failed to bend (no-loop). In (c), the yellow lines on the control larva corresponds to the lines drown in Image J to measure the width and length of embryos heads. (d) Length and width of the heads were measured from the indicated number of control, nup133 MO and nup133 MO+wt mRNA larvae. Box plots were generated using KaleidaGraph (Synergy Software): each box encloses 50% of the normalized values obtained, centered on the median value. The bars extending from the top and bottom of each box mark the minimum and maximum values within the dataset falling within an acceptable range. Values falling outside of this range are displayed as an individual point. Statistical analyses were performed using Wilcoxon-Mann-Whitney Rank Sum Test provided by the KaleidaGraph software. Standard conventions for symbols indicating statistical significance are used: ns, not significant: P> 0.05; *:P ≤ 0.05, ** :P ≤ 0.01, *** :P ≤ 0.001. Images and regions used for quantification of exocrine pancreas positioning and head sizes are available at Mendeley under doi:10.17632/j78ddshctz.1 EXPRESSION / LABELING:
PHENOTYPE:
|
|
ZFIN is incorporating published figure images and captions as part of an ongoing project. Figures from some publications have not yet been curated, or are not available for display because of copyright restrictions. PHENOTYPE:
|
|
ZFIN is incorporating published figure images and captions as part of an ongoing project. Figures from some publications have not yet been curated, or are not available for display because of copyright restrictions. PHENOTYPE:
|