
Fig. S2
- ID
- ZDB-IMAGE-190711-22
- Genes
- Publication
- Cianciolo Cosentino et al., 2019 - Moderate Nucleoporin 133 deficiency leads to glomerular damage in zebrafish
- All Figures
- Figures for Cianciolo Cosentino et al., 2019
|
Fig. S2
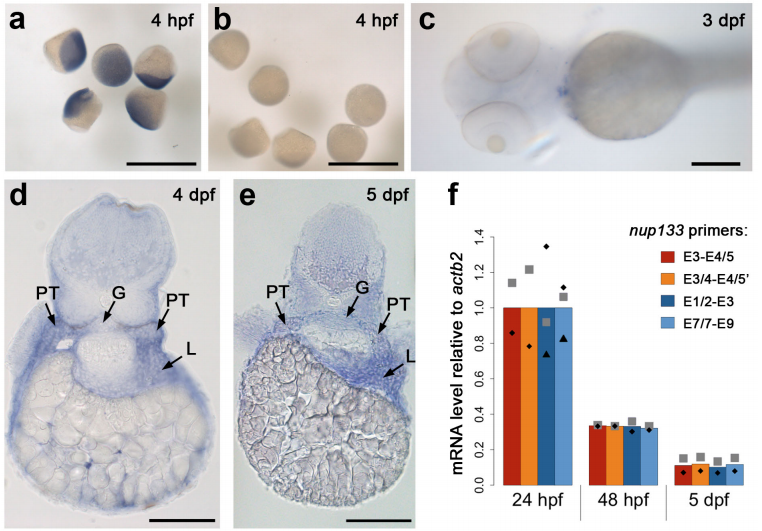
Analysis of nup133 expression in zebrafish embryos by in situ mRNA hybridization (ISH) and quantitative RT-PCR (RT-qPCR). Zebrafish embryos were hybridized with antisense (a, d, e) or sense (b, c) nup133 mRNA probes. Whole mount ISH at sphere stage (a, b, scale bars 1 mm) and 3 dpf (c, scale bar 200 µm), and transverse sections of 4 and 5 dpf embryo at the level of the pectoral fins (d, e, scale bars, 100 µm) are presented. (f) nup133 mRNA levels relative to actb2 expression was determined by RT-qPCR on 24 hpf, 48 hpf and 5 dpf embryos using 4 distinct primer pairs (listed in Supplementary Table S1 and positioned above the scheme of nup133 exon structure in Figure 2a). For each pair of primers, the mean of 2-3 distinct experiments (each represented by a distinct symbol) was set to 1 at 24 hpf.