
- Title
-
Co-option of the PRDM14-CBFA2T complex from motor neurons to pluripotent cells during vertebrate evolution
- Authors
- Kawaguchi, M., Sugiyama, K., Matsubara, K., Lin, C.Y., Kuraku, S., Hashimoto, S., Suwa, Y., Yong, L.W., Takino, K., Higashida, S., Kawamura, D., Yu, J.K., Seki, Y.
- Source
- Full text @ Development
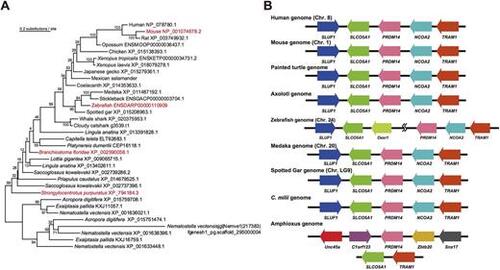
Molecular phylogeny and synteny conservation for the metazoan Prdm14 gene. (A) A maximum-likelihood tree was constructed using amino acid sequences of 34 metazoan Prdm14 orthologues. Orthologues in red were used in this study. The grouping of these sequences as Prdm14 orthologues was confirmed with our preliminary phylogenetic tree inference, including Prdm4, Prdm6 and Prdm12 (Fig. S1A). (B) Synteny conservation of genomic regions containing Prdm14 genes among deuterostomes. |

zPRDM14, but not sPRDM14, compensate for transcriptional regulation in mPrdm14 KO ESCs. (A) Western blot analysis of PRDM14 orthologues. (B) Morphology of wild-type ESCs and mPrdm14 KO ESCs expressing the empty vector, sPrdm14, zPrdm14 or mPrdm14. Scale bar: 50 μm. (C) Relative expression levels of the indicated genes in wild-type ESCs and mPrdm14 KO ESCs expressing the empty vector, sPrdm14, zPrdm14 or mPrdm14. Each Ct value was subtracted from the Ct values for wild-type ESCs and is shown as the log2 with the s.e.m. (two technical replicates). (D) ChIP-qPCR analysis for the enrichment of the indicated PRDM14 orthologues in mPrdm14 KO ESCs. The enrichment of each orthologue is indicated by the percent input with the SEM (two technical replicates). nd, not detected. |
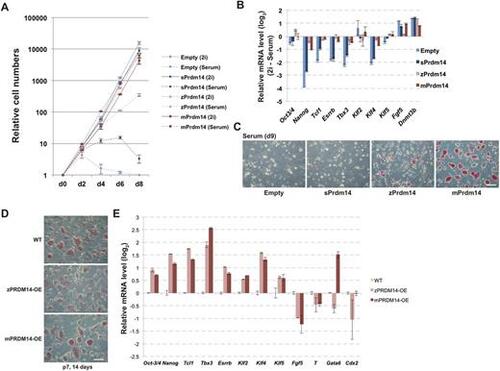
zPRDM14, but not sPRDM14, maintains the self-renewal of mPrdm14 KO ESCs under the serum plus LIF condition. (A) The growth rate of mPrdm14 KO ESCs expressing the empty vector, sPrdm14, zPrdm14 or mPrdm14 under the serum plus or 2i plus LIF condition. The mean values are shown with the s.e.m. (three biological replicates). (B) Relative expression levels of the indicated genes. Each Ct value measured under the 2i plus LIF condition was subtracted from that measured under the serum plus LIF and is shown with the s.e.m. (two technical replicates). (C,D) AP activity of mPrdm14 KO ESCs expressing the empty vector, sPrdm14, zPrdm14 or mPrdm14 cultured in medium containing serum plus LIF for 9 days (C) or 2 weeks at seven passages (D). Scale bars: 50 μm. (E) Relative expression levels of the indicated genes in wild-type ESCs and mPrdm14 KO ESCs expressing zPrdm14 or mPrdm14 and cultured for 2 weeks. Each Ct value was subtracted from that in wild-type ESCs and is shown with the s.e.m. (two technical replicates). |
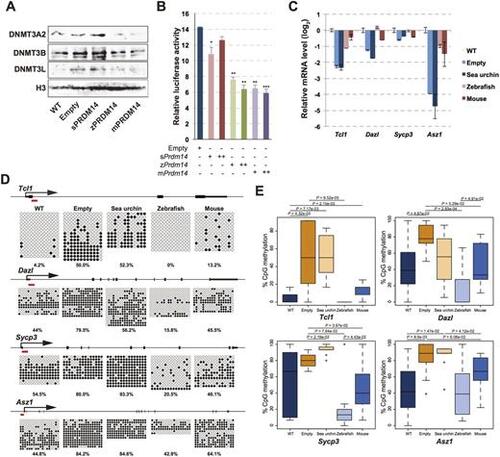
zPRDM14, but not sPRDM14, induces hypomethylation at pluripotency-associated genes and germline-specific genes. (A) Western blotting of DNMT3A, DNMT3B and DNMT3L in wild-type ESCs and in mPrdm14 KO ESCs expressing the empty vector, sPRDM14, zPRDM14 or mPRDM14. (B) Luciferase activity driven by Dnmt3b against each PRDM14 orthologue. Relative luciferase activities of the pGL3-basic vector are shown with the s.e.m. (biological triplicates). P values were calculated using Student's t-test. *P<0.05, **P<0.01, ***P<0.001. (C) qRT-PCR analysis of pluripotency-associated genes and germ-line specific genes in wild-type ESCs and mPrdm14 KO ESCs expressing the empty vector, sPRDM14, zPRDM14 or mPRDM14. Each Ct value was subtracted from that in wild-type ESCs and is shown with the s.e.m. (two technical replicates). (D) DNA-methylation status of pluripotency-associated genes and germline-specific genes in wild-type ESCs and mPrdm14 KO ESCs expressing the empty vector, sPRDM14, zPRDM14 or mPRDM14 were measured by bisulphite sequencing. The red bars indicate the primer positions. The white circles indicate unmethylated cytosine or 5-formylcytosine or 5-carboxylcytosine, and black circles indicate 5-methylcytosine or 5-hydroxymethylcytosine. (E) Boxplot based on the bisulphite sequencing data. The central bars indicate the medians and lower and upper limits of the boxes, marking the 25th and 75th percentiles. P values were calculated using the Mann–Whitney U-test. |
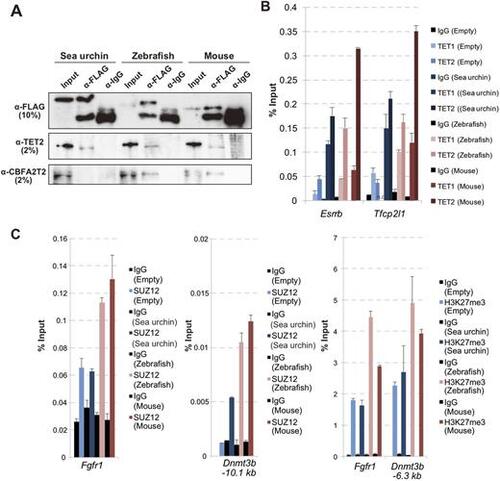
zPRDM14, but not sPRDM14, interacts with mCBFA2T2. (A) Co-IP analysis of each PRDM14 orthologue with TET2 and CBFA2T2. (B) ChIP-qPCR analysis of TET1 and TET2 binding at pluripotency-associated genes in wild-type ESCs or mPrdm14 KO ESCs expressing the empty vector, sPRDM14, zPRDM14 or mPRDM14. The enrichment of TET1 and TET2 are indicated by the percent input with the s.e.m. (two technical replicates). (C) ChIP-qPCR analysis of SUZ12 and H3K27me3 at Fgfr1 and Dnmt3b. The enrichment of SUZ12 and H3K27me3 are shown by the percent input with the s.e.m. (two technical replicates). |
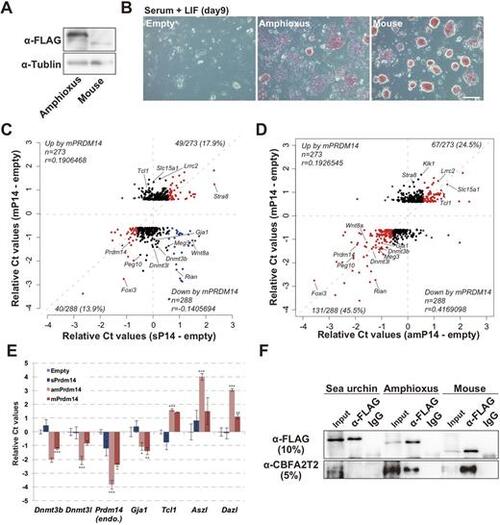
amPRDM14 can compensate for lost mPRDM14 function in ESCs. (A) Western blot analysis of amPRDM14 and mPRDM14 expression. (B) Cellular morphology and AP activity in ESCs cultured in medium containing serum plus LIF for 9 days. Scale bar: 50 μm. (C,D) Scatter plot of microarray data showing the relative intensities of genes upregulated or downregulated by mouse PRDM14. The horizontal axis shows the relative intensities of microarray probes from sPRDM14-expressing (C) or amPRDM14-expressing (D) mPrdm14 KO ESCs relative to mPrdm14 KO ESCs expressing the empty vector. The red dots indicate genes that were co-upregulated or co-downregulated by expression of mPRDM14 and either sPRDM14 or amPRDM14. The blue dots indicate genes whose expression levels were negatively correlated after exposure to mPRDM14 and either sPRDM14 or amPRDM14. (E) Relative expression levels of the indicated genes in mPrdm14 KO ESCs expressing the empty vector, sPRDM14, zPRDM14 or mPRDM14. Each Ct value is subtracted from that found in mPrdm14 KO ESCs expressing the empty vector. The error bars indicate the s.e.m. of biological triplicates. P values were calculated by Tukey's multiple-comparison test. *P<0.05, **P<0.01, ***P<0.001. (F) Co-IP analysis of sPRDM14, amPRDM14 and mPRDM14 with CBFA2T2. |
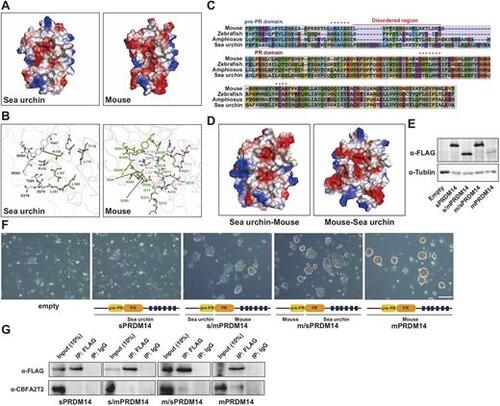
The pre-PR domain is responsible for the incompatibility of sPRDM14 with mCBFA2T2. (A) Electrostatic charge distribution of the binding pocket of mPRDM14 and sPRDM14 with mCBFA2T2. (B) Residues involved in the negative charge of the binding surface of sPRDM14 and mPRDM14 with mCBFA2T2 are shown as sticks. (C) Alignment of the amino acid sequences of the pre-PR and PR domain derived from mPRDM14, zPRDM14, amPDM14 and sPRDM14. Red asterisks indicate the amino acids involved in hydrogen bonding with mCBFA2T2. (D) Electrostatic charge distribution of the binding pocket of chimeric protein constructed by sPRDM14 and mPRDM14. (E) Western blot analysis of sPRDM14, s/mPRDM14, m/sPRDM14 and mPRDM14. (F) Colonies stained for AP activity in Prdm14 KO ESCs expressing the empty vector, sPRDM14, s/mPRDM14, m/sPRDM14 or mPRDM14, after being transferred to medium containing serum plus LIF for 9 days. Scale bar: 50 μm. (G) Co-IP of sPRDM14, s/mPRDM14, m/sPRDM14 or mPRDM14 with mCBFA2T2. |
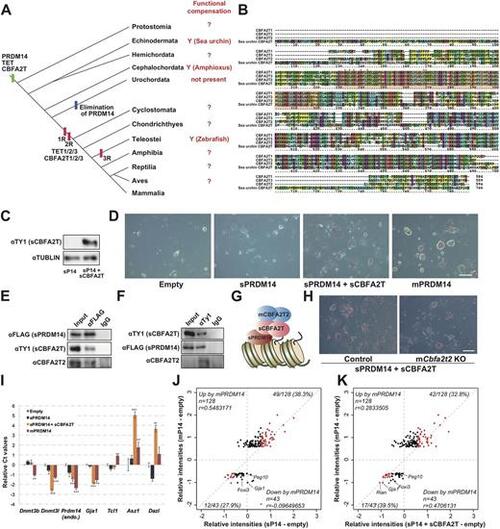
Combined expression of sPRDM14 and sCBFA2T compensate for lost mPRMD14 function. (A) Distribution of Prdm14, Tet and Cbfa2t family genes in metazoans and functional compensation results (?, currently not examined; Y, functional compensation). (B) Alignment of the amino acid sequences of mCBFA2T1, mCBFA2T2, mCBFA2T3 and sCBFA2T. The red shading underneath the sequences indicates the NHR1 domain. Red asterisks show the amino acids involved in the hydrogen bonding between mCBFA2T2 and mPRDM14. (C) Western blot against sCBFA2T in Prdm14 KO ESCs expressing sPRDM14. (D) Colonies stained for AP activity in Prdm14 KO ESCs expressing the empty vector, sPRDM14, mPRDM14 or sPRDM14 with sCBFA2T, after being transferred to medium containing serum plus LIF for 9 days. Scale bar: 50 μm. (E) Co-IP of sPRDM14 with sCBFA2T and mCBFA2T2. (F) Co-IP of sCBFA2T with sPRDM14 and mCBFA2T2. (G) A model of the transcriptional regulation by sPRDM14 with sCBFA2T in mPrdm14 KO ESCs. (H) Colonies stained for AP activity in mPrdm14 KO ESCs expressing sPRDM14 and sCBFA2T2, and mPrdm14 and mCbfa2t2 KO expressing sPRDM14 and sCBFA2T2, after being transferred to medium containing serum plus LIF for 9 days. Scale bar: 50 μm. (I) Relative expression levels of the indicated genes in mPrdm14 KO ESCs expressing the empty vector, sPRDM14, sPRDM14 with sCBFA2T or mPRDM14. Each Ct value is subtracted from that found in mPrdm14 KO ESCs expressing the empty vector. The error bars indicate the s.e.m. of biological triplicates. P values were calculated by Tukey's multiple-comparison test. *P<0.05, **P<0.01, ***P<0.001. (J) Scatter plot of microarray data showing the relative intensities of genes upregulated or downregulated by mouse PRDM14. The horizontal axis shows the relative intensities of microarray probes from sPRDM14-expressing (I) or sPRDM14 and sCBFA2T co-expressing (K) mouse Prdm14 KO ESCs relative to Prdm14 KO ESCs expressing the empty vector. The red dots indicate genes that were co-upregulated or co-downregulated by mPRDM14 and sPRDM14 or sPRDM14 with sCBFA2T. The blue dot in J indicates a gene whose expression levels were negatively correlated after exposure to mPRDM14 and sPRDM14. |
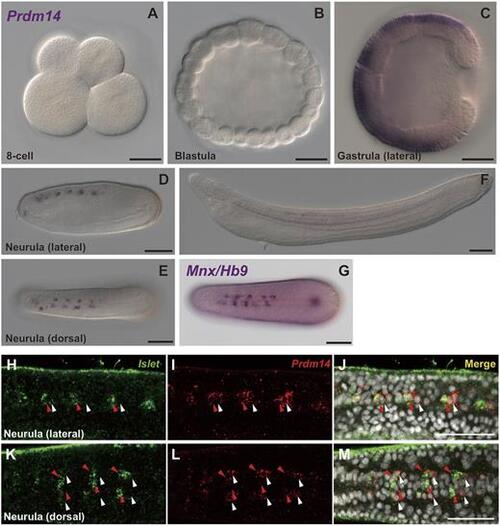
amPrdm14 was expressed in motor neurons in amphioxus embryos. (A-G) Distribution of Prdm14 and Mnxb RNA in amphioxus embryos. (H-M) Fluorescent double labelling of Islet RNA (green) and Prdm14 RNA (red) in amphioxus embryos at the neurula stage. White arrowheads indicate Prdm14-positive/Islet-negative cells. Red arrowheads indicate cells positive for both Prdm14 and Islet. Scale bars: 50 µm. |