
Fig. 6
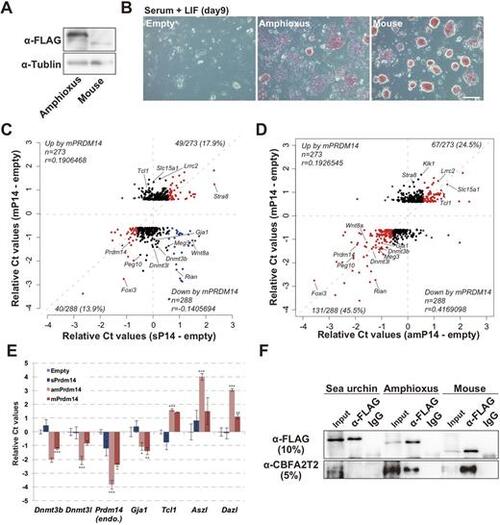
amPRDM14 can compensate for lost mPRDM14 function in ESCs. (A) Western blot analysis of amPRDM14 and mPRDM14 expression. (B) Cellular morphology and AP activity in ESCs cultured in medium containing serum plus LIF for 9 days. Scale bar: 50 μm. (C,D) Scatter plot of microarray data showing the relative intensities of genes upregulated or downregulated by mouse PRDM14. The horizontal axis shows the relative intensities of microarray probes from sPRDM14-expressing (C) or amPRDM14-expressing (D) mPrdm14 KO ESCs relative to mPrdm14 KO ESCs expressing the empty vector. The red dots indicate genes that were co-upregulated or co-downregulated by expression of mPRDM14 and either sPRDM14 or amPRDM14. The blue dots indicate genes whose expression levels were negatively correlated after exposure to mPRDM14 and either sPRDM14 or amPRDM14. (E) Relative expression levels of the indicated genes in mPrdm14 KO ESCs expressing the empty vector, sPRDM14, zPRDM14 or mPRDM14. Each Ct value is subtracted from that found in mPrdm14 KO ESCs expressing the empty vector. The error bars indicate the s.e.m. of biological triplicates. P values were calculated by Tukey's multiple-comparison test. *P<0.05, **P<0.01, ***P<0.001. (F) Co-IP analysis of sPRDM14, amPRDM14 and mPRDM14 with CBFA2T2. |