
Fig. 8
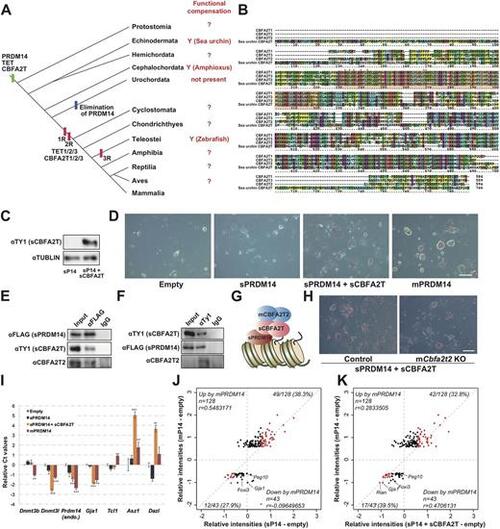
Combined expression of sPRDM14 and sCBFA2T compensate for lost mPRMD14 function. (A) Distribution of Prdm14, Tet and Cbfa2t family genes in metazoans and functional compensation results (?, currently not examined; Y, functional compensation). (B) Alignment of the amino acid sequences of mCBFA2T1, mCBFA2T2, mCBFA2T3 and sCBFA2T. The red shading underneath the sequences indicates the NHR1 domain. Red asterisks show the amino acids involved in the hydrogen bonding between mCBFA2T2 and mPRDM14. (C) Western blot against sCBFA2T in Prdm14 KO ESCs expressing sPRDM14. (D) Colonies stained for AP activity in Prdm14 KO ESCs expressing the empty vector, sPRDM14, mPRDM14 or sPRDM14 with sCBFA2T, after being transferred to medium containing serum plus LIF for 9 days. Scale bar: 50 μm. (E) Co-IP of sPRDM14 with sCBFA2T and mCBFA2T2. (F) Co-IP of sCBFA2T with sPRDM14 and mCBFA2T2. (G) A model of the transcriptional regulation by sPRDM14 with sCBFA2T in mPrdm14 KO ESCs. (H) Colonies stained for AP activity in mPrdm14 KO ESCs expressing sPRDM14 and sCBFA2T2, and mPrdm14 and mCbfa2t2 KO expressing sPRDM14 and sCBFA2T2, after being transferred to medium containing serum plus LIF for 9 days. Scale bar: 50 μm. (I) Relative expression levels of the indicated genes in mPrdm14 KO ESCs expressing the empty vector, sPRDM14, sPRDM14 with sCBFA2T or mPRDM14. Each Ct value is subtracted from that found in mPrdm14 KO ESCs expressing the empty vector. The error bars indicate the s.e.m. of biological triplicates. P values were calculated by Tukey's multiple-comparison test. *P<0.05, **P<0.01, ***P<0.001. (J) Scatter plot of microarray data showing the relative intensities of genes upregulated or downregulated by mouse PRDM14. The horizontal axis shows the relative intensities of microarray probes from sPRDM14-expressing (I) or sPRDM14 and sCBFA2T co-expressing (K) mouse Prdm14 KO ESCs relative to Prdm14 KO ESCs expressing the empty vector. The red dots indicate genes that were co-upregulated or co-downregulated by mPRDM14 and sPRDM14 or sPRDM14 with sCBFA2T. The blue dot in J indicates a gene whose expression levels were negatively correlated after exposure to mPRDM14 and sPRDM14. |