
- Title
-
Quinoxaline protects zebrafish lateral line hair cells from cisplatin and aminoglycosides damage
- Authors
- Sanchez, S.M.R., Fuson, O., Tarang, S., Goodman, L., Pyakurel, U., Liu, H., He, D.Z., Zallocchi, M.
- Source
- Full text @ Sci. Rep.

Qx protects against cisplatin ototoxicity. 5dpf Tg(brn3c:GFP) larvae were incubated with vehicle alone (DMSO, A), 400 μM of cisplatin (CP, B), pre-treated with Qx for 2 hours and then incubated with CP for 6 hours (Qx, CP, C,E,G) or pre-treated with Qx for 2 hours and then co-treated with Qx and CP for 6 more hours (Qx + CP, D,F,H). Animals were fixed and immunostained for GFP (green) and otoferlin (red). (I) Quantification of the number of hair cells per neuromast after the different treatments represented as mean +/− SEM. One-way ANOVA, Dunnett post test. *p < 0.05, ***p < 0.001. Black asterisks compared versus control. Red asterisks compared versus CP 400 µM. (J) Scores for neuromast morphology (see Materials and Methods). Scale bar: 6 μm. Data were taken from at least 20 animals and 3 experiments runs. |
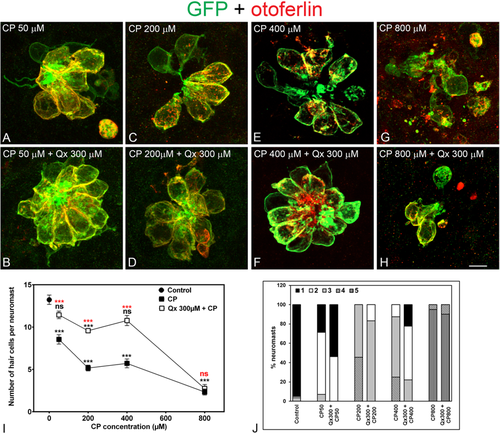
Dose protection curve against CP. 5dpf Tg(brn3c:GFP) larvae were incubated with 50 µM to 800 µM of CP (A,C,E,G) for 6 hours or pre-treated with 300 µM of Qx for 2 hours and then co-treated with Qx and CP (50µM-800µM) for 6 hours (B,D,F,H). Animals were fixed and immunostained for GFP (green) and otoferlin (red). Control animals were exposed to vehicle alone (DMSO). (I) Quantification of the number of hair cells per neuromast after the different treatments represented as mean +/− SEM. One-way ANOVA, Dunnett post test. ***p < 0.001. Black asterisks compared versus DMSO-treated animals. Red asterisks compared versus the corresponding CP concentration. (J) Scores for neuromast morphology (see Materials and Methods). Scale bar: 6 μm. Data were taken from at least 20 animals and 3 experiments runs. |
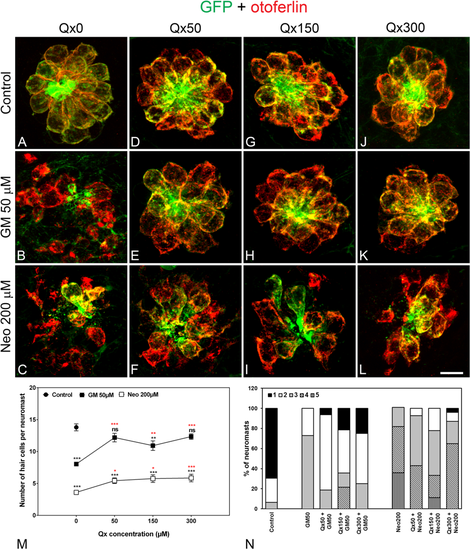
Dose protection curve against aminoglycosides. 5dpf larvae were incubated with vehicle (E3, A) or with 50 μM (D–F), 150 μM (G–I) or 300 μM (J–L) of Qx for a total of 8 hours. Gentamicin (GM, 50 μM, B,E,H,K) or neomycin (Neo, 200 µM,C,F,I,L) were added during the last 60 min or 30 min of incubation, respectively. Animals were fixed and stained for otoferlin (red) and GFP (green). (M) Quantification of the number of hair cells per neuromast after the different treatments represented as mean +/− SEM. Note that since no significant differences were found in the number of hair cells per neuromast when animals were incubated with the different Qx concentrations (0–300 µM, A,D,G,J), the control value represents the average of all these treatments. One-way ANOVA, Dunnett post test. *p < 0.05, **p < 0.01, ***p < 0.001. Black asterisks compared versus control. Red asterisks compared versus the corresponding aminoglycoside-only treatment. (N) Scores for neuromast morphology (see Materials and Methods). Scale bar: 7 μm. Data were taken from at least 20 animals and 3 experiments runs. |

Qx protects against the acute phase of gentamicin ototoxicity. 5dpf zebrafish were treated for 60 min with gentamicin (GM) 50 μM-200 μM (A,C,E,G) or pre-treated for 7 hours with Qx 300 μM followed by co-treatment with Qx and gentamicin for 1 more hour (B,D,F,H). Untreated or Qx-treated animals were used as controls. (G,H) Animals treated with GM 50 µM, with or without 300 µM of Qx were transferred for 5 hours to fresh E3 media before fixation. Fixed animals were immunostained for otoferlin (red), counterstained with phalloidin (green) and analyzed by confocal microscopy. (I) Quantification of the number of hair cells per neuromast after the different treatments represented as mean +/− SEM. One-way ANOVA, Dunnett post test. *p < 0.05, **p < 0.01, ***p < 0.001. Black asterisks compared versus control. Red asterisk compared versus the corresponding GM-only treatment. For recovery experiments: Black asterisk compared versus control animals, red asterisk compared versus GM-only treatment without recovery. (J) Scores for neuromast morphology. Scale bar: 7 μm. Data were taken from at least 20 animals and 3 experiments runs. |
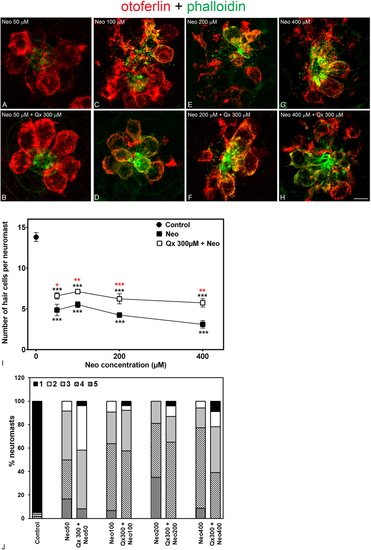
Qx partially protects against acute exposure to neomycin. 5dpf larvae were treated for 30 min with neomycin (Neo) 50 μM-400 μM (A,C,E,G) or for 8 hours with Qx 300 μM and Neo was added 30 min before the end of the incubation time (B,D,F,H). Untreated or Qx-treated animals were used as controls. Animals were fixed, stained for otoferlin (red) and phalloidin (green) and analyzed by confocal microscopy. (I) Quantification of the number of hair cells per neuromast after the different treatments represented as mean +/− SEM. One-way ANOVA, Dunnett post test. *p < 0.05, **p < 0.01, ***p < 0.001. Black asterisks compared versus control. Red asterisk compared versus the corresponding Neo-only treatment. (J) Scores for neuromast morphology. Scale bar: 6 μm. Data were taken from at least 20 animals and 3 experiments runs. |
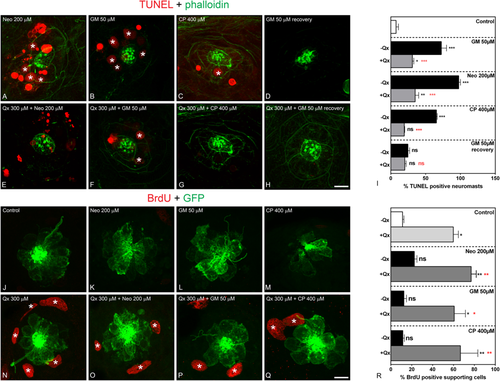
Qx protects against ototoxin-induced HC death and promotes supporting cell proliferation. (A–I) TUNEL assay (red) was performed in zebrafish incubated with vehicle or 300 µM of Qx alone (controls) or with the corresponding ototoxin with or without Qx 300 µM. Animals were counterstained with phalloidin (green). (A) Neomycin (Neo) 200 µM incubation for 30 min. (B) Gentamicin (GM) 50 µM incubation for 1 hour. (C) Cisplatin (CP) 400 µM incubation for 2 hours. (D) GM 50 µM incubation for 1 hour followed by recovery for 5 hours. (E) Incubation with Qx 300 µM for 8 hours and Neo 200 µM for 30 min. (F) Incubation with Qx 300 µM for 8 hours and GM 50 µM for 1 hour. (G) Qx 300 µM for 8 hours + CP 400 µM for 2 hours. (H) Qx 300 µM incubation for 8 hours + GM 50 µM for 1 hour followed by 5 hours recovery. Asterisks denote TUNEL-positive HCs. (I) The percentage of TUNEL-positive neuromasts was calculated for each treatment and represented as mean +/− SEM. (J–R) Proliferation assays were performed in 5dpf Tg(brn3c:GFP) in the presence/absence of Qx and the corresponding ototoxin, by the BrdU-labelling method (red). Animals were immunostained for GFP (green). (J) control. (K) Neo 200 µM 30 min. (L) GM 50 µM 1 hour. (M) CP: 400 µM 2 hours. (N) Qx 300 µM 8 hours. (O) Qx 300 µM 8 hours + Neo 200 µM 30 min. (P) Qx 300 µM 8 hours + GM 50 µM 1 hour. (Q) Qx 300 µM 8 hours + CP 400 µM 2 hours. Asterisks denote neuromast supporting cells positive for BrdU. (R) The percentage of BrdU-positive supporting cells per neuromast was calculated for each treatment and represented as mean +/− SEM. One-way ANOVA, *p < 0.05, **p < 0.01. Black asterisks compared versus corresponding control. Red asterisk compared versus the corresponding ototoxin-only treatment. Scale bar: (A–H) 10 µm, (J–O) 7 μm. Data were taken from at least 15 animals and 3 experiments runs. EXPRESSION / LABELING:
PHENOTYPE:
|
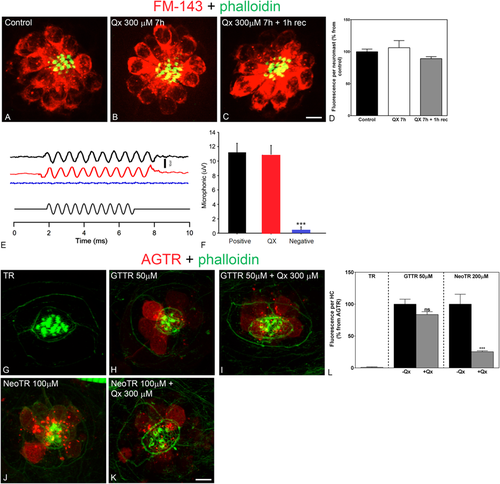
Treatment with Qx does not abolish mechanotransduction channel activity. 5dpf wild type larvae were incubated in E3 media (A), Qx 300 μM for 7 hours and immediately assayed for FM1-43 uptake (B) or Qx, 300 µM, recovered for 1 hour and then treated with the dye (C). Quantification of the fluorescent intensity per neuromast (D) was expressed as percentage from controls. No significant differences were observed between control and treated animals (unpaired Student’s t-test). (E,F) Microphonic potentials from animals treated with vehicle (black) or 300 μM of Qx (red). Pcdh15a mutants were used as a negative control (blue). Microphonic responses are represented as mean +/− SD. Only the Pcdh15a mutants showed a significant decrease in microphonic potentials compared to controls (unpaired Student’s t-test). (G–L) 5dpf zebrafish were incubated with hydrolyzed Texas Red (TR, G) for 1 hour, gentamicin-conjugated Texas Red (GTTR, H) 50 µM for 1 hour, Qx 300 µM for 8 hours +GTTR 50 µM for 1 hour before the end of the experiment (I), neomycin-conjugated Texas Red (NeoTR, J) 100 µM for 30 min or with Qx 300 µM for 8 hours +NeoTR 100 µM for 30 min before the end of the experiment (K). (L) The fluorescence intensity incorporated per HC was expressed as a percentage from the corresponding aminoglycoside-Texas Red (AGTR) incubation treatment and represented as mean +/− SEM. Unpaired Student’s t-test. ***p < 0.001. Student’s t-test versus corresponding aminoglycoside-only treatment. Scale bar: (A–C) 6 μm, (G–K) 5 µm. Data were taken from at least 10 animals and 3 experiments runs. For microphonic potentials 8–9 animals were analyzed per treatment. PHENOTYPE:
|