
Fig. 2
- ID
- ZDB-IMAGE-181121-2
- Genes
- Antibodies
- Publication
- Sanchez et al., 2018 - Quinoxaline protects zebrafish lateral line hair cells from cisplatin and aminoglycosides damage
- All Figures
- Figures for Sanchez et al., 2018
|
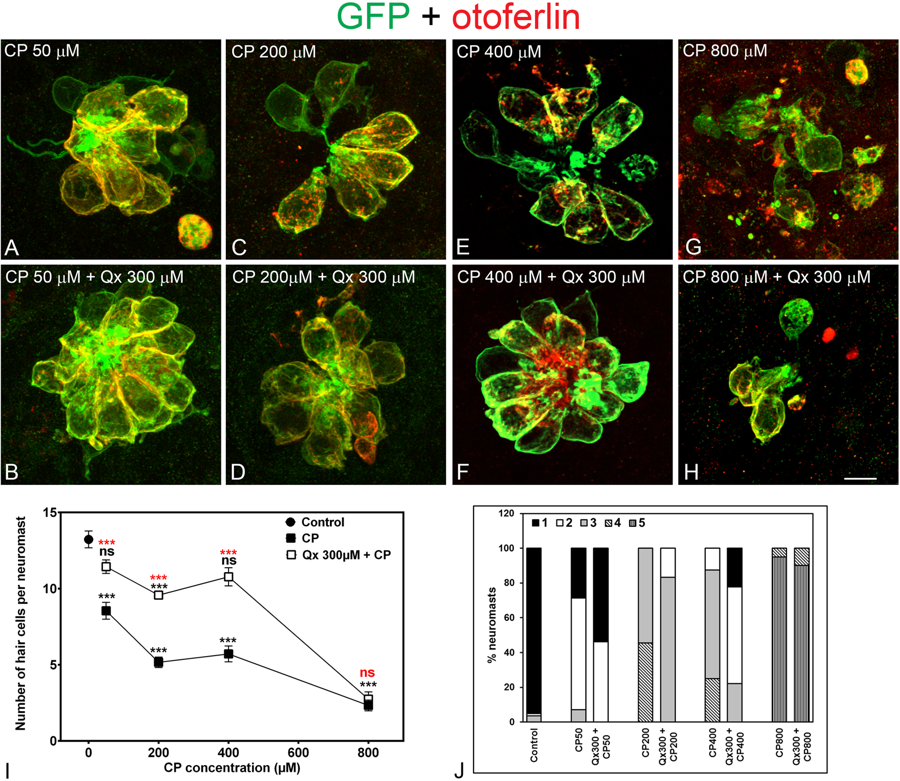
Fig. 2
Dose protection curve against CP. 5dpf Tg(brn3c:GFP) larvae were incubated with 50 µM to 800 µM of CP (A,C,E,G) for 6 hours or pre-treated with 300 µM of Qx for 2 hours and then co-treated with Qx and CP (50µM-800µM) for 6 hours (B,D,F,H). Animals were fixed and immunostained for GFP (green) and otoferlin (red). Control animals were exposed to vehicle alone (DMSO). (I) Quantification of the number of hair cells per neuromast after the different treatments represented as mean +/− SEM. One-way ANOVA, Dunnett post test. ***p < 0.001. Black asterisks compared versus DMSO-treated animals. Red asterisks compared versus the corresponding CP concentration. (J) Scores for neuromast morphology (see Materials and Methods). Scale bar: 6 μm. Data were taken from at least 20 animals and 3 experiments runs.