
- Title
-
A Whole Brain Staining, Embedding, and Clearing Pipeline for Adult Zebrafish to Visualize Cell Proliferation and Morphology in 3-Dimensions
- Authors
- Lindsey, B.W., Douek, A.M., Loosli, F., Kaslin, J.
- Source
- Full text @ Front. Neurosci.
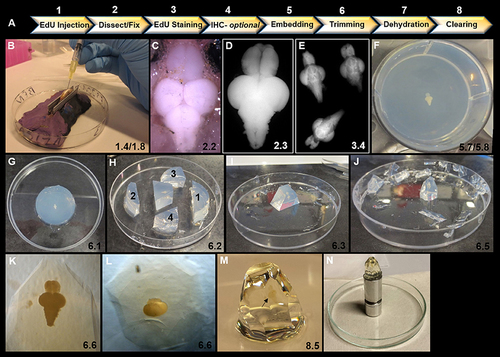
Overview of key steps in sample preparation for optical projection tomography (OPT). (A) Summary of 8 step workflow for sample preparation for OPT scanning. (B) Intraperitoneal injection of 40 μL of EdU into ventral abdomen of adult zebrafish using a 1 mL syringe and 30 gauge × ½ inch needle. Note the use of V-shaped holder to orient and stabilize the anesthetized specimen during injection. (C) Dorsal view of adult zebrafish brain in situ prior to excision and fixation. (D) Excised adult zebrafish brain fixed in 2% paraformaldyhyde. (E) Representative image of three adult brains in EdU staining solution in a 12-well plate. (F) Adult brain embedded dorsally and centered in well and in z-plane in low melting agarose in a 6-well plate. (G) Low melting agarose cylinder removed from 6-well plate in preparation for trimming. (H) Initial trimming using a razor blade to form a trapezoid by 4 sequential cuts: (1) perpendicular to olfactory bulbs, (2) perpendicular to and ~1 cm from spinal cord, and (3 and 4) two lateral diagonal cuts joining 1 and 2 together. (I) Trapezoid oriented upright with brain positioned along the long-axis vertically. Olfactory bulbs are localized at the top of the block. (J) Trimmed block ready for dehydration and clearing. Notice block is tapered from top to bottom to reduce agarose around brain sample for scanning and to provide a larger base to adhere to mount. (K–L) Position of brain within trimmed block viewed under brightfield observed along the long-axis (K) and from the dorsal aspect of the block (L). (M) Adult zebrafish brain (black arrow) observed en block following methanol dehydration and BABB clearing. Note the transparent nature of the brain. (N) Sample adhered to an OPT mount in preparation for scanning. In all panels, the corresponding detailed protocol steps are denoted in the bottom right-hand corner. |
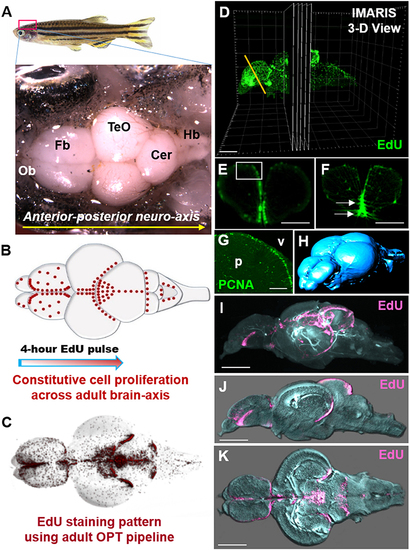
Whole brain EdU labeling and 3-dimensional OPT scanning recapitulates the constitutive pattern of cell proliferation in the adult zebrafish brains. (A) Dorsal view of adult zebrafish brain displaying major structures along the A-P neuro-axis. Ob, olfactory bulbs; Fb, forebrain; TeO, optic tectum; Cer, cerebellum; Hb, hindbrain. (B) Schematic dorsal view of adult brain showing the known constitutive pattern (Kaslin et al., 2008) of cell proliferation (red dots) along the brain axis following a 4-h EdU chase. (C) Dorsal view of EdU staining using our adult OPT pipeline demonstrating the same labeling pattern across the brain axis as in (B). (D) Example of IMARIS 3-D visualization output of an adult EdU injected brain (green) illustrating the ability to visualize or analyse regions of interest in cross-section (or other planes). Yellow line depicts level of telencephalic cross-section shown in (E,F). (E,F) Cross-sections through the adult zebrafish telencephalon showing examples of optimal (E; near cellular resolution) and suboptimal (F) EdU staining (green)/OPT imaging along the periventricular neurogenic niche following data reconstructions. White box in (E) denotes dorsal telencephalic domain shown in (G). White arrows in (F) show EdU that was over-exposed during scanning, while the slightly fussy image indicates that the post-processing software reconstruction was of poor quality. (G) Antibody labeling using Proliferating Cell Nuclear Antigen (PCNA) displaying the homeostatic pattern of cell proliferation at the dorsal telencephalon from cryosectioned, confocal-imaged tissue. Note that labeling is restricted to the stem cell niche adjacent the forebrain ventricle (v) with little to no staining within the parenchyma (p). (H) Anterior-dorsal view of iso-surface rendered adult brain (blue) using IMARIS software derived from initial OPT autofluorescence scans of brain contour. (I–K) Constitutive brain EdU labeling (pink) across the neuro-axis merged with an autofluorescence scan of brain morphology/volume (pale blue) shown in mid-sagittal (I,J) and horizontal (K) views. In (J,K) images were rendered in IMARIS. Scale bars: (E,F) = 300 μm; (G) = 150 μm; (D,I–K) = 500 μm. |
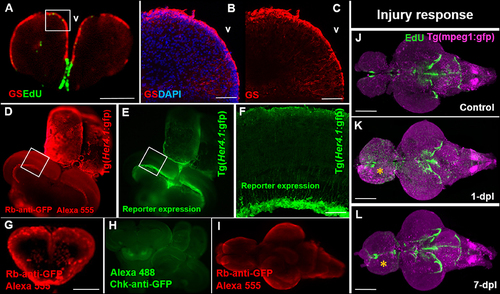
Compatibility of immunohistochemistry with OPT pipeline. (A) Successful double-labeling and OPT scanning of EdU (green) and the glial marker, glutamine synthetase (GS; red) in the adult zebrafish forebrain. White box denotes images shown in (B,C). (B,C) Co-labeling with DAPI (blue; B) and single (C) antibody labeling of GS (red) in cryosectioned, confocal-imaged tissue confirming the specificity of GS labeling shown using our OPT pipeline. (D,E) Whole brain immunohistochemistry in the adult zebrafish using a rabbit-anti-GFP primary antibody conjugated to Alexa 555 (D) recapitulates the same staining pattern seen with the endogenous GFP reporter in the Tg(Her4.1:gfp) transgenic line (E) prior to dehydration and clearing. White boxes in (D,E) depicts location of image displayed in (F). (F) GFP-positive staining in the deep quiescent glial layer of the periventricular gray zone of the adult optic tectum shown in cryosectioned, confocal-imaged tissue in the Tg(Her4.1:gfp) line mimicking the GFP pattern seen in tissue prepared using our OPT pipeline. (G–I) Examples of poor antibody penetration (G), poor immuno-labeling, and (I) quenched antibody staining post-OPT imaging using different GFP antibodies. (J–L) Adult control brain (J) in the Tg(mpeg1:gfp) macrophage line injected with EdU compared with brains post telencephalic lesion (yellow symbol) examined at 1-day post lesion (dpl; K) and 7-dpl (L) for changes in macrophage distribution (purple) and cell proliferation (green). Scale bars: A, G = 300 μm; B-C = 150 μm; F = 200 μm; J-K = 500 μm. |
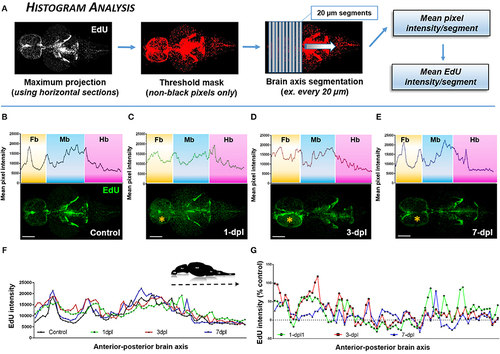
Identifying the proliferative profile across the brain axis following injury using Histogram Analysis. (A) Histogram Analysis workflow using FIJI/IMAGEJ showing a maximum projection derived from horizontal sections and overlayed with a threshold mask to detect only non-black pixels. By segmenting the brain along the A-P axis the mean pixel intensity/segment can be used to represent the mean EdU intensity/segment. (B–E) Mean pixel intensity of EdU per segment plotted as a histogram across the brain axis displaying conspicuous peaks in brain regions where greater EdU labeling (green) is present shown in control (B; n = 5 brains) and 1-dpl (C; n = 4 brains), 3-dpl (D; n = 4 brains), and 7-dpl (E; n = 5 brains) treated animals. The yellow asterisk denotes the lesioned telencephalic hemisphere. Fb, forebrain; Mb, midbrain; Hb, hindbrain. (F,G) EdU intensity plotted across the A-P brain axis compared across all groups (F) and normalized as the percent change from control (G). Scale bars: (B–E) = 500 μm. |
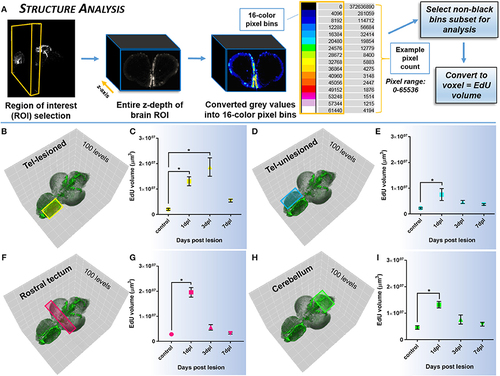
Investigating systemic changes in cell proliferation within major brain subdivisions following brain injury using Structure Analysis. (A) Structure Analysis workflow using FIJI/IMAGEJ showing z-depth of brain region of interest converted from grayscale to 16-color pixel bins to obtain pixel counts/non-black bins for final analysis of EdU volume in voxels. Cross-sectional view shown is from the forebrain telencephalon. The 16-color pixel bins are arranged from cooler to warmer colors, indicating greater pixel intensity values at the upper end of the pixel range. (B–I) Proliferative response across four major adult brain structures compared to control in the adult zebrafish brain at 3 time-points (1, 3, 7-dpl) following telencephalic lesion. Brain structures analyzed are indicated by colored rectangles overlayed on 3-D rendered adult zebrafish brains at 3-dpl (EdU, green). For all structures a total of 100 pixel levels through the A-P axis were used for quantification, with Structure Analysis performed on all 15 non-black pixel bins. (B,C) Lesioned telencephalic hemisphere (yellow; n = 5–10 brains/group) displaying a significant increase in EdU volume compared to control at 1-dpl and 3-dpl. (D–I) Unlesioned telencephalic hemisphere (D,E; blue; n = 6–10 brains/group), rostral tectum (F,G; pink; n = 4–10 brains/group), and cerebellum (H,I, green; n = 4–10 brains/group) showing a significant increase in EdU volume from control at 1-dpl. *Significance was accepted at p < 0.05; One-way ANOVA, Tukey's post-hoc test for multiple comparisons. |
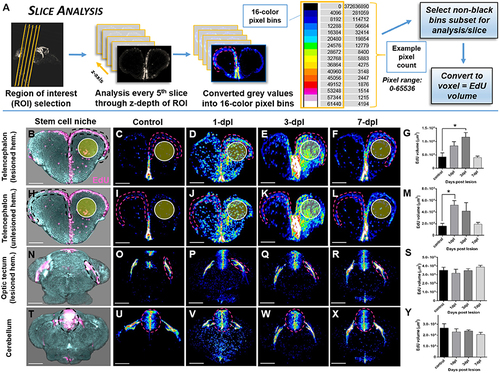
Investigating systemic changes in adult stem cell niche proliferation following brain injury using OPT Slice Analysis. (A) Slice Analysis workflow using FIJI/IMAGEJ showing every 5th pixel slice converted from grayscale to 16-color pixel bins to obtain pixel counts/non-black bins for final analysis of EdU volume in voxels. Cross-sections shown are from the forebrain telencephalon, with pink hashed lines denoting an example sub-region for analysis. The 16-color pixel bins are arranged from cooler to warmer colors, indicating greater pixel intensity values at the upper end of the pixel range. (B–Y) Proliferative response across four major adult stem cell niches compared to control in the adult zebrafish brain at 3 time-points (1, 3, 7-dpl) following telencephalic lesion. The site of lesion is denoted by the yellow circle. Hashed lines demarcate the stem cell niche quantified using Slice Analysis. (B,H,N,T) Representative 3-D rendered images from OPT datasets displaying stem cell niches denoted by EdU staining (pink). All other image panels show maximum projections of representative cross-sections converted to 16-color (FIJI look up table, LUT) for analysis of control and lesioned treatments. For analysis, pixel counts derived from only the first 3 non-black bins were used (i.e., 4,096, 8,192, 12,288). (B–G) Lesioned hemisphere (ipsilateral; n = 5–8 brains/group) of the pallial stem cell niche showing a significant increase in EdU volume from control at 3-dpl. (H-M) Unlesioned (contralateral; n = 5–8 brains/group) hemisphere of the pallial stem cell niche showing a significant increase in EdU volume from control at 1-dpl. (N–S,T–Y) Both tectal (N–S; n = 4–10 brains/group) and cerebellar (T–Y; n = 4–7 brains/group) stem cell niches situated more posterior to the site of injury revealed no significant difference at any of time-points post-lesion. *Significance was accepted at p < 0.05; One-way ANOVA, Tukey's post-hoc test for multiple comparisons. Scale bars: (B–F,H–L,N–R,T–X) = 150 μm. |
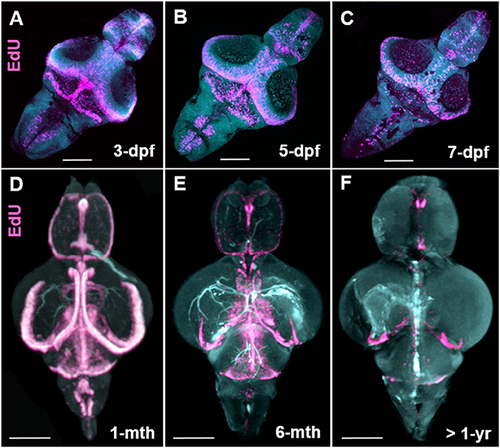
Stem cell niche development over zebrafish ontogeny. (A–C) Whole mount EdU (pink) staining and confocal imaging in transparent larvae at 3-, 5-, and 7-dpf visualized in 3-D using IMARIS, displaying the early pattern of cell proliferation throughout the developing zebrafish brain. (D–F) Whole mount EdU (pink) staining and OPT scanning in juvenile (D), adult (E), and senescent (F) brains visualized in 3-D using IMARIS, depicting a reduction in constitutive cell proliferation within stem cell niches situated along the A-P brain axis. Dpf, days post fertilization; mth, month; yr, year. Scale bars = 500 μm. |

Morphological variation in brain structures across inbred medaka strains. (A–F) Adult medaka brains in dorsal and mid-sagittal views from the H05 (A,B), HNI (C,D), and iCab (E,F) inbred strains scanned using autofluorescence to investigate morphological variation in the growth/volume of major brain structures. The white region seen on brains depicts autofluorescence of vasculature (H05), or additional pigment left on the brain at the time of imaging (HNI, iCab). Green and yellow overlays on brains denote the neuroanatomical structures used for volume calculations shown in (G,H). (G,H) Example volume calculation using IMARIS comparing the size of a single telencephalic hemisphere (G, green) and cerebellum (H, yellow) across the three inbred medaka strains. Scale bars = 500 μm. |