
|
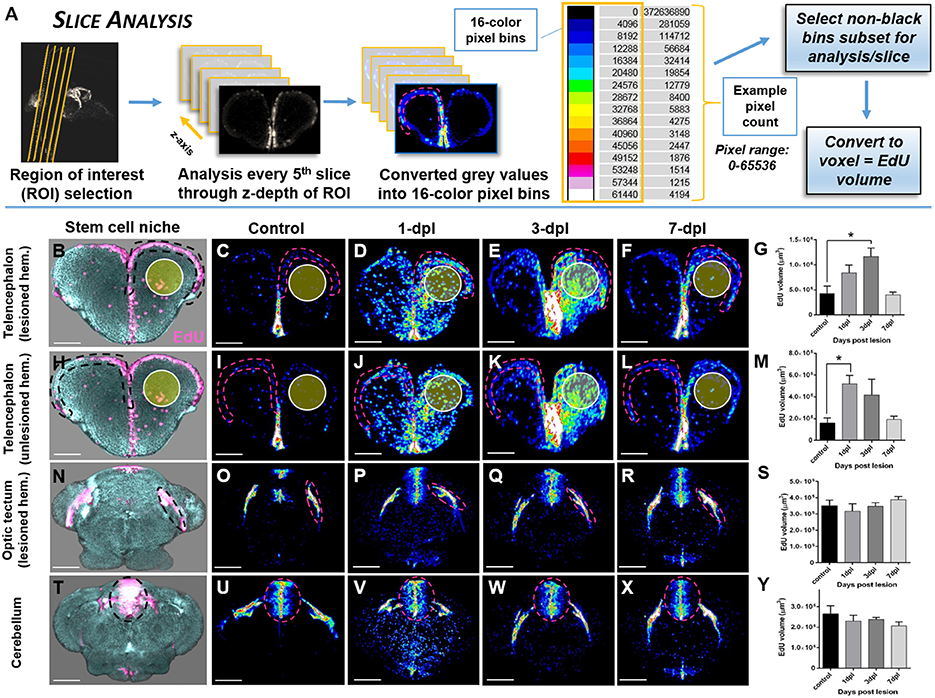
Fig. 6
Investigating systemic changes in adult stem cell niche proliferation following brain injury using OPT Slice Analysis. (A) Slice Analysis workflow using FIJI/IMAGEJ showing every 5th pixel slice converted from grayscale to 16-color pixel bins to obtain pixel counts/non-black bins for final analysis of EdU volume in voxels. Cross-sections shown are from the forebrain telencephalon, with pink hashed lines denoting an example sub-region for analysis. The 16-color pixel bins are arranged from cooler to warmer colors, indicating greater pixel intensity values at the upper end of the pixel range. (B–Y) Proliferative response across four major adult stem cell niches compared to control in the adult zebrafish brain at 3 time-points (1, 3, 7-dpl) following telencephalic lesion. The site of lesion is denoted by the yellow circle. Hashed lines demarcate the stem cell niche quantified using Slice Analysis. (B,H,N,T) Representative 3-D rendered images from OPT datasets displaying stem cell niches denoted by EdU staining (pink). All other image panels show maximum projections of representative cross-sections converted to 16-color (FIJI look up table, LUT) for analysis of control and lesioned treatments. For analysis, pixel counts derived from only the first 3 non-black bins were used (i.e., 4,096, 8,192, 12,288). (B–G) Lesioned hemisphere (ipsilateral; n = 5–8 brains/group) of the pallial stem cell niche showing a significant increase in EdU volume from control at 3-dpl. (H-M) Unlesioned (contralateral; n = 5–8 brains/group) hemisphere of the pallial stem cell niche showing a significant increase in EdU volume from control at 1-dpl. (N–S,T–Y) Both tectal (N–S; n = 4–10 brains/group) and cerebellar (T–Y; n = 4–7 brains/group) stem cell niches situated more posterior to the site of injury revealed no significant difference at any of time-points post-lesion. *Significance was accepted at p < 0.05; One-way ANOVA, Tukey's post-hoc test for multiple comparisons. Scale bars: (B–F,H–L,N–R,T–X) = 150 μm.