
|
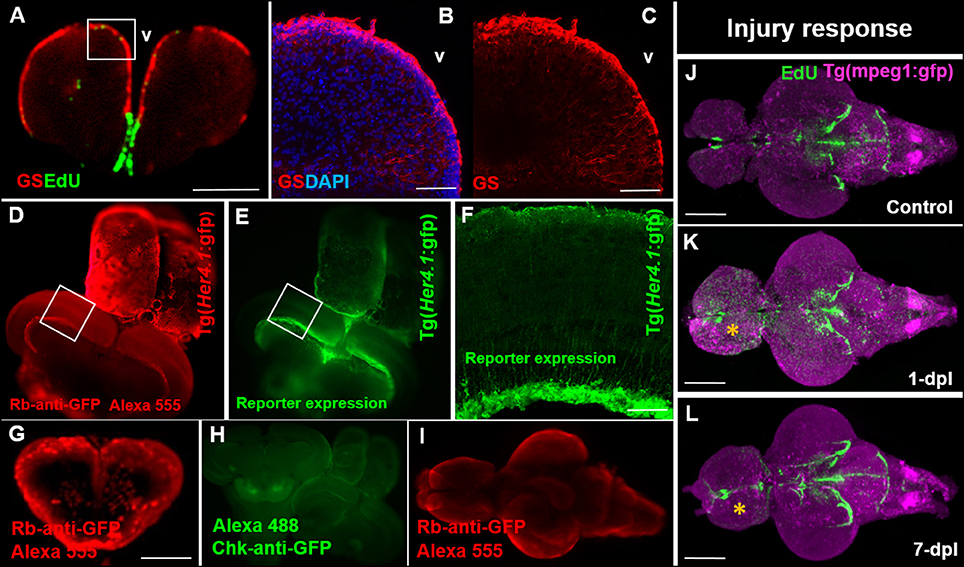
Fig. 3
Compatibility of immunohistochemistry with OPT pipeline. (A) Successful double-labeling and OPT scanning of EdU (green) and the glial marker, glutamine synthetase (GS; red) in the adult zebrafish forebrain. White box denotes images shown in (B,C). (B,C) Co-labeling with DAPI (blue; B) and single (C) antibody labeling of GS (red) in cryosectioned, confocal-imaged tissue confirming the specificity of GS labeling shown using our OPT pipeline. (D,E) Whole brain immunohistochemistry in the adult zebrafish using a rabbit-anti-GFP primary antibody conjugated to Alexa 555 (D) recapitulates the same staining pattern seen with the endogenous GFP reporter in the Tg(Her4.1:gfp) transgenic line (E) prior to dehydration and clearing. White boxes in (D,E) depicts location of image displayed in (F). (F) GFP-positive staining in the deep quiescent glial layer of the periventricular gray zone of the adult optic tectum shown in cryosectioned, confocal-imaged tissue in the Tg(Her4.1:gfp) line mimicking the GFP pattern seen in tissue prepared using our OPT pipeline. (G–I) Examples of poor antibody penetration (G), poor immuno-labeling, and (I) quenched antibody staining post-OPT imaging using different GFP antibodies. (J–L) Adult control brain (J) in the Tg(mpeg1:gfp) macrophage line injected with EdU compared with brains post telencephalic lesion (yellow symbol) examined at 1-day post lesion (dpl; K) and 7-dpl (L) for changes in macrophage distribution (purple) and cell proliferation (green). Scale bars: A, G = 300 μm; B-C = 150 μm; F = 200 μm; J-K = 500 μm.