
Image
|
Figure Caption
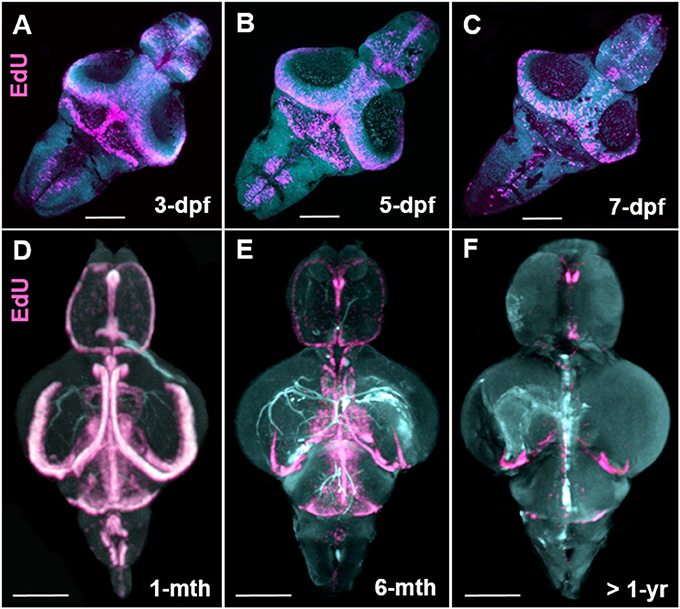
Fig. 7
Stem cell niche development over zebrafish ontogeny. (A–C) Whole mount EdU (pink) staining and confocal imaging in transparent larvae at 3-, 5-, and 7-dpf visualized in 3-D using IMARIS, displaying the early pattern of cell proliferation throughout the developing zebrafish brain. (D–F) Whole mount EdU (pink) staining and OPT scanning in juvenile (D), adult (E), and senescent (F) brains visualized in 3-D using IMARIS, depicting a reduction in constitutive cell proliferation within stem cell niches situated along the A-P brain axis. Dpf, days post fertilization; mth, month; yr, year. Scale bars = 500 μm.
Acknowledgments
This image is the copyrighted work of the attributed author or publisher, and
ZFIN has permission only to display this image to its users.
Additional permissions should be obtained from the applicable author or publisher of the image.
Full text @ Front. Neurosci.