
|
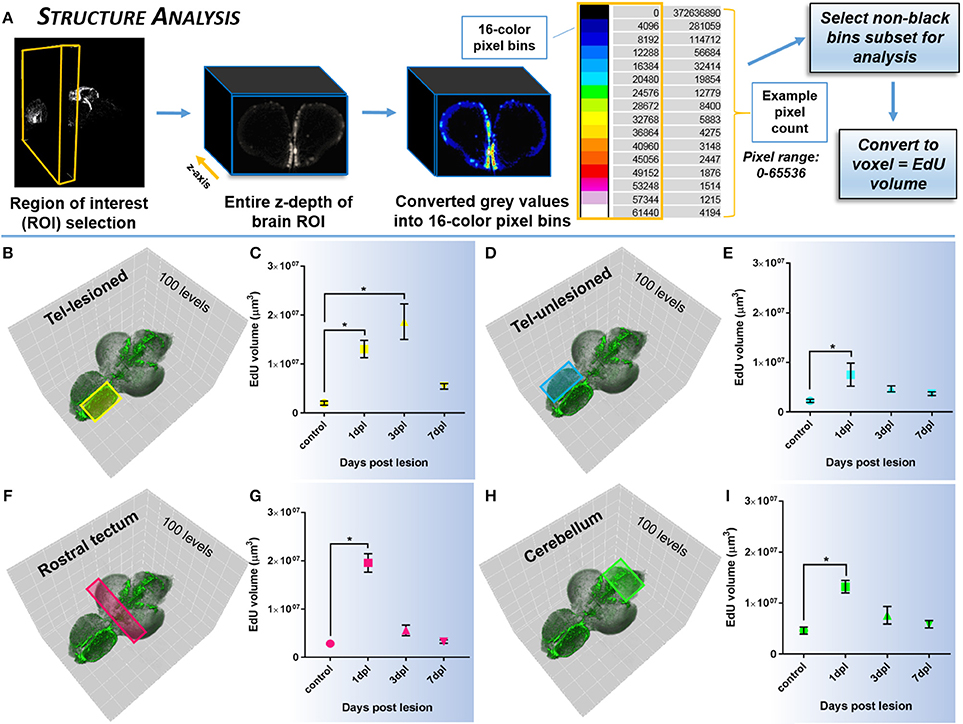
Fig. 5
Investigating systemic changes in cell proliferation within major brain subdivisions following brain injury using Structure Analysis. (A) Structure Analysis workflow using FIJI/IMAGEJ showing z-depth of brain region of interest converted from grayscale to 16-color pixel bins to obtain pixel counts/non-black bins for final analysis of EdU volume in voxels. Cross-sectional view shown is from the forebrain telencephalon. The 16-color pixel bins are arranged from cooler to warmer colors, indicating greater pixel intensity values at the upper end of the pixel range. (B–I) Proliferative response across four major adult brain structures compared to control in the adult zebrafish brain at 3 time-points (1, 3, 7-dpl) following telencephalic lesion. Brain structures analyzed are indicated by colored rectangles overlayed on 3-D rendered adult zebrafish brains at 3-dpl (EdU, green). For all structures a total of 100 pixel levels through the A-P axis were used for quantification, with Structure Analysis performed on all 15 non-black pixel bins. (B,C) Lesioned telencephalic hemisphere (yellow; n = 5–10 brains/group) displaying a significant increase in EdU volume compared to control at 1-dpl and 3-dpl. (D–I) Unlesioned telencephalic hemisphere (D,E; blue; n = 6–10 brains/group), rostral tectum (F,G; pink; n = 4–10 brains/group), and cerebellum (H,I, green; n = 4–10 brains/group) showing a significant increase in EdU volume from control at 1-dpl. *Significance was accepted at p < 0.05; One-way ANOVA, Tukey's post-hoc test for multiple comparisons.