
|
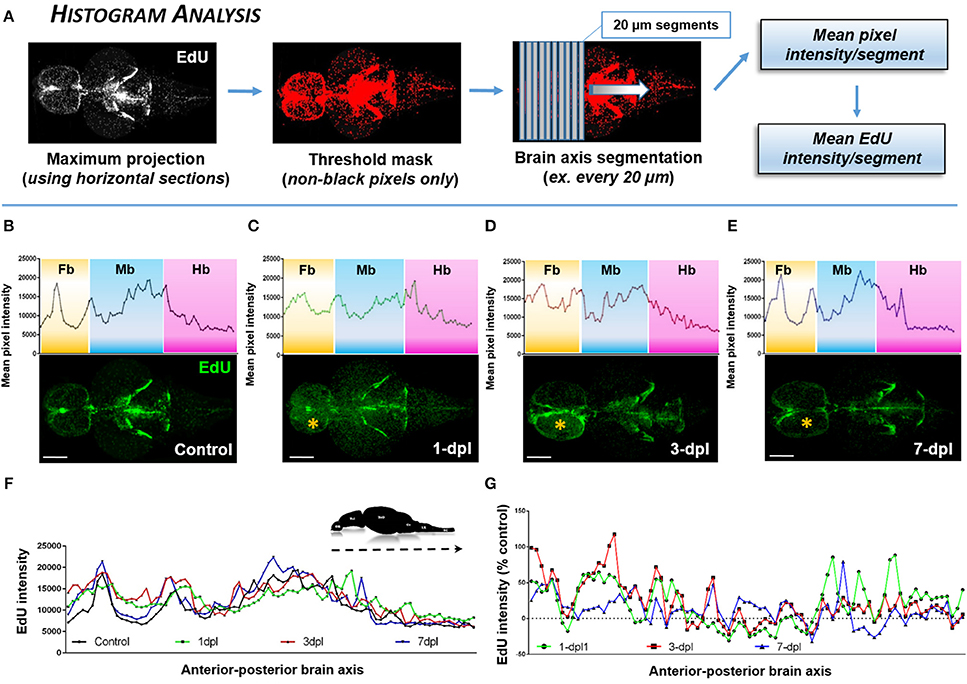
Fig. 4
Identifying the proliferative profile across the brain axis following injury using Histogram Analysis. (A) Histogram Analysis workflow using FIJI/IMAGEJ showing a maximum projection derived from horizontal sections and overlayed with a threshold mask to detect only non-black pixels. By segmenting the brain along the A-P axis the mean pixel intensity/segment can be used to represent the mean EdU intensity/segment. (B–E) Mean pixel intensity of EdU per segment plotted as a histogram across the brain axis displaying conspicuous peaks in brain regions where greater EdU labeling (green) is present shown in control (B; n = 5 brains) and 1-dpl (C; n = 4 brains), 3-dpl (D; n = 4 brains), and 7-dpl (E; n = 5 brains) treated animals. The yellow asterisk denotes the lesioned telencephalic hemisphere. Fb, forebrain; Mb, midbrain; Hb, hindbrain. (F,G) EdU intensity plotted across the A-P brain axis compared across all groups (F) and normalized as the percent change from control (G). Scale bars: (B–E) = 500 μm.