
- Title
-
Neuroprotective Role of the PI3 Kinase/Akt Signaling Pathway in Zebrafish
- Authors
- Chen, S., Liu, Y., Rong, X., Li, Y., Zhou, J., Lu, L.
- Source
- Full text @ Front Endocrinol (Lausanne)
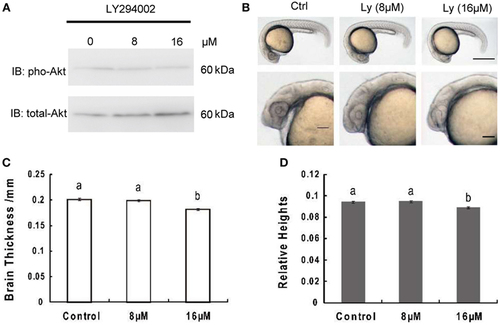
Inhibition of phosphoinositide 3-kinase leads to decrease of brain size significantly over growth retardation. (A) Representative Western immunoblots using antibodies for phosphorylated and total Akt on embryos treated with 8 μM, 16 μM, or without LY294002. Note the increase in total levels of Akt and gradually decreased phosphorylated Akt in LY294002 treated embryos compared to controls. Similar results were obtained in three other treatment experiments. (B) Morphology of 24 hpf embryos of wild type and treated with 8 µM, 16 µM LY294002. The top panel, scale bar = 500 μm; the bottom panel shows a close-up of the head region, scale bar = 200 μm. (C) Brain thickness and (D) relative heights of embryos from control group and embryos treated with 8 µM, 16 µM LY294002. Results are from three independent microinjection experiments, each with 30 embryos per group. P < 0.05 compared with the control group. |
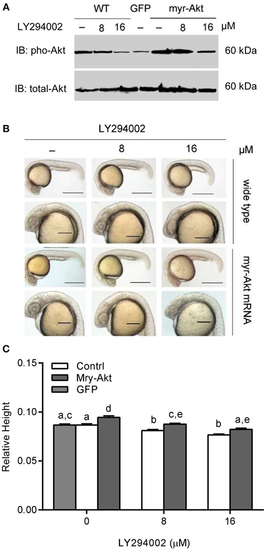
Phosphoinositide 3-kinase inhibition associated brain size decrease was recovered by myr-Akt overexpression. (A) Western immunoblots using antibody for phosphorylated Akt on embryos of wide-type and injected with myr-Akt mRNA treated with 8 µM, 16 µM, or without LY294002 or control mRNA (encoding GFP), with total Akt as a loading control. (B) Morphology of 24 hpf embryos of wild type and myr-Akt mRNA-injected group, treated with 8 µM, 16 µM, or without LY294002. GFP mRNA was injected as control mRNA. The first and third panel from the top, scale bar = 500 μm; the second and fourth panel displayed a close-up of the head region, scale bar = 200 μm. (C) Relative brain height of embryos with GFP or myr-Akt injected, treated with 8 µM, 16 µM, or without LY294002. Results are from three independent microinjection experiments, each with 25 embryos per group. P < 0.05 compared with the wide-type control group. |
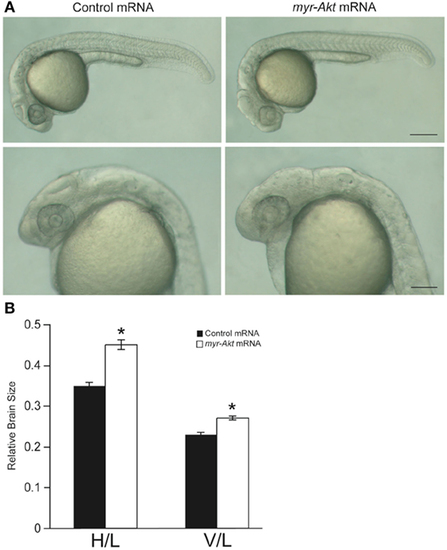
Overexpression of myr-Akt increases brain size in zebrafish embryos. (A) Morphology of zebrafish embryos injected with either control mRNA (left panels) or myr-Akt mRNA (right panels). Scale bar = 250 μm for top panels, and 100 µm for bottom panels. (B) Relative brain size measurements based on horizontal brain height (H) or vertical brain length (V), divided by inner ear to tail embryo length (L). Injection of myr-Akt significantly increased brain size compared to controls. N = 20 total embryos measured from two independent microinjection experiments, 10 embryos per group (*P < 0.0001). |
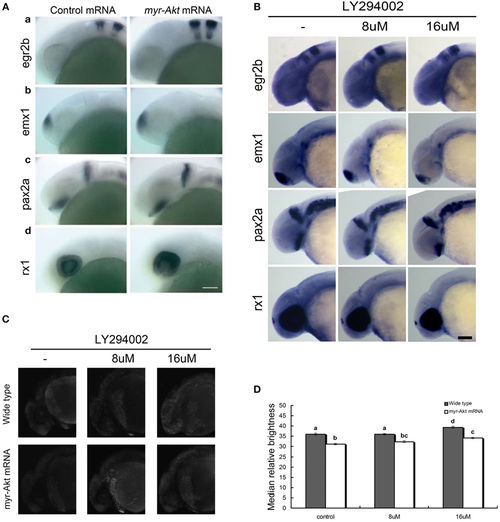
Neuronal cell abundance, but not fate, is affected by Akt overexpression through influencing apoptosis. (A) Representative whole mount in situ hybridization images of control mRNA (left panels) or myr-Akt mRNA-injected embryos (right panels) using probes for (a) egr2b (third and fifth rhombomeres of the hindbrain), (b) emx1 (forebrain), (c) pax2a (optic stalk, mid-hindbrain boundary), and (d) rx1 (retina). N = 9–13 embryos per group, all with similar expression patterns. Scale bar = 100 µm. (B) Whole mount in situ hybridization of embryos treated with or without LY294002 using probes as (A). (C) Acridine orange staining of 24 hpf wild-type and myr-Akt mRNA-injected embryos treated without or with 8 µM, 16 µM LY294002. Scale bar = 100 μm. (D) Graphical representation of percentages of Median relative brightness of brain region after AO staining in each treatment group. N = 15 images quantified per treatment group. Groups with different letters differ significantly from each other (P < 0.05). |
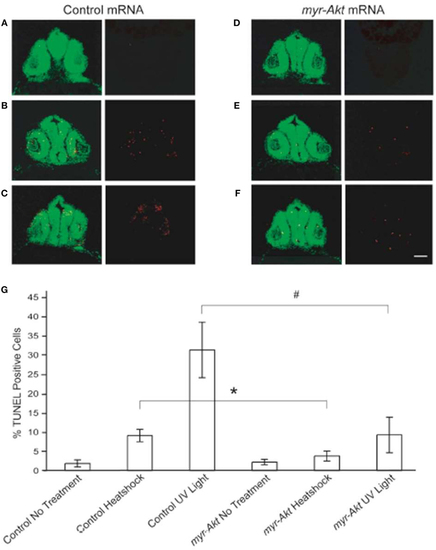
Constitutively activated Akt protect neuronal cell from heatshock and UV light-induced apoptosis. Representative images of cryosectioned control mRNA (A–C) or myr-Akt mRNA-injected embryos, (D–F) stained using TUNEL (red) and the nuclear dye, Sytox (green). Images on right side of panels are TUNEL only, while left side are overlaid images of TUNEL and Sytox staining. (A,D) Embryos without treatment; (B,E) embryos administered heatshock; (C,F) embryos administered UV light. Scale bar = 50 μm. (G) Graphical representation of percentages of TUNEL-positive cells in each treatment group. N = 6 images quantified per treatment group (*P < 0.05; #P < 0.001). |