
- Title
-
Repulsive cues combined with physical barriers and cell-cell adhesion determine progenitor cell positioning during organogenesis
- Authors
- Paksa, A., Bandemer, J., Hoeckendorf, B., Razin, N., Tarbashevich, K., Minina, S., Meyen, D., Biundo, A., Leidel, S.A., Peyrieras, N., Gov, N.S., Keller, P.J., Raz, E.
- Source
- Full text @ Nat. Commun.

PGCs are motile at the gonad region. (a) PGCs migrate from four different positions in the embryo (green clusters in 6 hpf image) towards the developing gonads to form two separate cell clusters by end of the first day of embryonic development (lateral and dorsal views). Insets display higher magnification of the gonad region (white boxes). Scale bars represent 50 μm. (b) A schematic cross-section of a 1-day-old zebrafish embryo showing the somites (magenta), the two separate PGC clusters (green cells) located on either side of the developing gut (red structure), as well as the expression of cxcl12a at this stage (yellow). (c) Snapshots from a time-lapse movie (Supplementary Movie 2) showing a lateral view of a PGC cluster starting at 24 hpf In the first three time points posterior migration of a PGC is highlighted (green track) and lateral–medial migration of the same PGC is presented in the following panels (yellow track). Scale bar, 25 μm. |
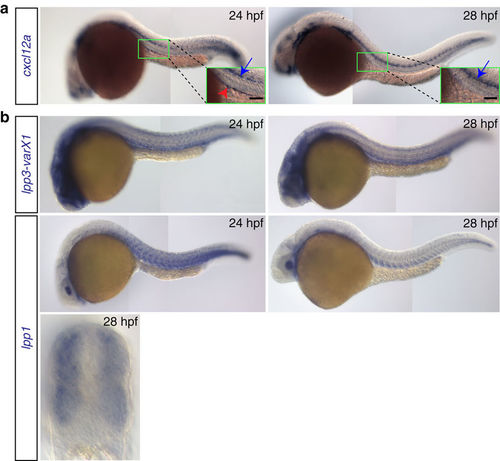
Expression patterns of cxcl12a and lpp variants. (a) cxcl12a is expressed at the site where the gonad develops within a 24 hpf embryo (green box and red arrowhead in the inset in the left panel), but not in 28 hpf embryos (right panel). Higher expression level of cxcl12a is detected in the lateral line (blue arrows). Scale bar, 50 μm. (b) lpp1 (variants X1 and X2) and lpp3 are expressed in the somites and developing vessels. See also Supplementary Fig. 3. EXPRESSION / LABELING:
|

PGCs avoid regions expressing LPP proteins. (a) Generation of embryos lacking Cxcl12a, whose PGCs are labelled by EGFP and overexpress either LPP proteins or a Control protein in mCherry-labelled half of the embryo. (b) PGCs avoid cellular domains of the embryos, which overexpress LPPs (middle row), as compared to control domains (top row) or those overexpressing phosphatase-inactive versions of LPPs (lower row). (c) A significant reduction in the percentage of PGCs located within the LPPs-overexpressing domain in 10 hpf embryos (one-way analysis of variance; *P≤0.05). Error bars designate minimum to maximum range of the data points. N and n show the number of embryos and PGCs, respectively. See also Supplementary Fig. 8. (d) mCherry-labelled cells overexpressing Cxcl12a with either a Control Protein or LPPs were transplanted into embryos lacking Cxcl12a (medny054) whose PGCs express EGFP. (e) Images and a graph demonstrating the association of PGCs with Cxcl12a-expressing cells in control embryos (upper image, magenta point in graph) and the lack of interaction with cells expressing Cxcl12a and LPPs (starred red cells in lower image, blue points in graph, 77% of embryos showed absolutely no cell association). The statistical significance was evaluated using the Mann–Whitney U-test (****P≤0.0001). Scale bar, 15 μm. See also Supplementary Movie 3 and Supplementary Fig. 9. |
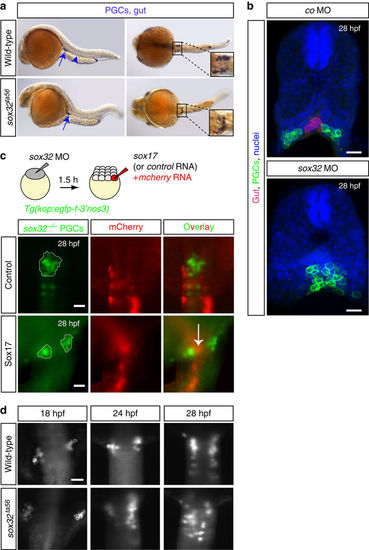
Lack of the developing gut causes PGC cluster fusion. (a) Whole-mount in situ hybridization on 30 hpf wild-type (N=420) and sox32 mutant embryos (N=89). PGCs are labelled with nanos3 (nos3, arrows) and the gut with foxa3 probe (arrowhead, missing in sox32 mutant embryos), both in blue. Unlike the separated PGC clusters in wild-type embryos, clusters are fused at the midline in sox32 mutant embryos (upper and lower panel images, respectively). Lateral (left panels) and dorsal (right panels) views are shown. (b) Cross-sections of 28 hpf sox17:dsred transgenic embryos whose gut is labelled in red and the PGCs membrane with EGFP. In control embryos (upper panel; N=5) bilateral PGC clusters form on either side of the gut tube. In embryos lacking the gut (Sox32-deficient; N=4) the PGC clusters fuse (lower panel). Nuclei counterstained with Hoechst. Scale bars, 25 μm. (c) Generation of mosaic embryos lacking Sox32 function in all cells whose endoderm is restored by providing Sox17 function to a group of cells (Scheme). The Sox32-deficient PGC clusters (green) are separated by the gut tissue at 28 hpf (red in lower panel, arrow; N=13), while in control embryos lacking endodermal tissues fused PGC clusters are observed (upper panel; N=24). Anterior is up. (d) PGC clusters in wild-type (N=20) and sox32 mutant (N=7) embryos lacking the gut tissue at 18, 24 and 28 hpf showing the dynamics of the fusion. N is the number of embryos analysed. Scale bar, 50 μm. Anterior is up. EXPRESSION / LABELING:
PHENOTYPE:
|
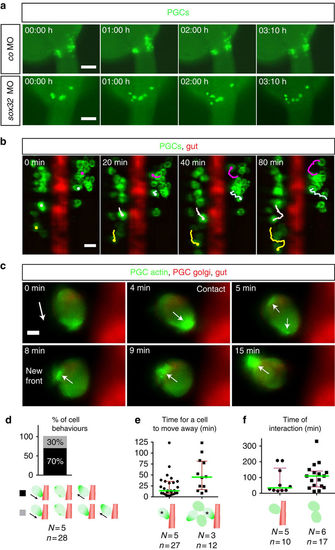
The developing gut functions as a physical barrier. (a) PGCs exhibiting dynamic movements within separated clusters (control, upper), while in embryos lacking the gut (lower panels) PGCs migrate over the midline to form one cluster (Supplementary Movie 4). Time point 0 corresponds to 24.5 hpf Scale bars, 100 μm. (b) Four representative migration tracks of PGCs relative to the gut (Supplementary Movie 5). PGC tracking using ImageJ. Scale bar, 25 μm. (c) Interaction of a PGC with the gut tube (Supplementary Movie 6). Polarity change in actin distribution is observed on contact. Time point 0 corresponds to 25 hpf The white arrow displays the direction of actin polarity. Scale bar, 5 μm. (d) PGC behaviours. On touching the gut, the main behaviour observed (29/42 encounters for 28 PGCs) is a rapid (14 min) polarity inversion away from the barrier and a change in the direction of migration. In the remaining encounters (13/42) PGCs exhibited a prolonged contact with the gut (69 min) without stable polariziation. (e) Cell crowding prolongs the time required for moving away from the barrier (45 versus 14 min; Mann–Whitney U-test, **P≤0.01). (f) Increased interaction time among PGCs that do not touch (right), as compared with the interaction time large and small clusters of the PGCs with the barrier (left). (d–f) Error bars display interquartile range, green lines median values, N and n number of embryos and PGCs respectively. The PGCs are shown in green and the gut in red (gut not presented in the right schematic drawing in f where PGC–PGC interaction time is displayed). PHENOTYPE:
|

cxcl12a and cxcl12b expression patterns following PGC arrival at the site where the gonad develops (a) cxcl12a expression at the gonad region of 24hpf-embryos is detected (using the sensitive RNAscope protocol, magenta bracket in the upper panel), along with much higher expression level in the lateral line (arrow). At 28hpf, only weak background level cxcl12a is detected where the PGCs reside. PGCs detected based on nanos3 (nos3) expression (white brackets). Nuclei stained with DAPI. dapB serves as a negative control. Merged overlay images presented on the right. Scale bar 25μm. Dorsal up. (b) cxcl12b RNA expression is not detectable at the gonad region in 24hpf control embryos, nor in embryos lacking the gut tube. Insets display a higher magnification of the gonad region. Scale bars 50μm. |

RNA expression pattern of zebrafish lpp variants lpp1-like, ppap2d and lpp2 RNA expression pattern of the lpp indicated variants. See also Fig. 2b. |
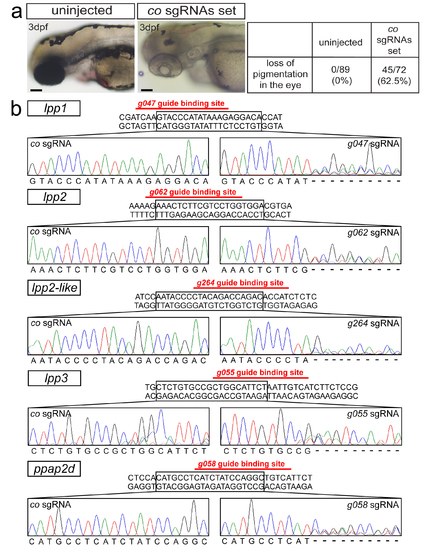
Single guide RNAs efficiency in generating mutations (a) Functionality of a set of control sgRNAs, demonstrated by loss of pigmentation in majority of the treated embryos at 3dpf as compared with uninjected embryos. Scale bars 200μm. (b) Efficiency of sgRNAs designed for lpp genes. Generation of the mutations by one sgRNA per gene-specific set (right panels), as evaluated by sequencing, compared with the results obtained using a control sgRNA (left panels) targeting the tyrosinase gene (G416 in Supplementary Table 3). Ambiguous sequence at the lpp sgRNA-binding region in the sequencing results confirms the efficiency of the genome-editing procedure. |

Somatic phenotype in lpp-sgRNA and MO-treated embryos (a) 28hpf embryos showing no morphological defects when treated with a mixture of lpp sgRNAs (Number of embryos examined: N=340), similar to uninjected (N=460) and control sgRNAs-injected (N=280) embryos. (b) Images and data presenting a range of somatic phenotypes of MO-treated 28hpf embryos knocked down for lpp function, compared with uninjected and embryos treated with 6 control MOs. The class1 embryos, that are the least affected morphologically, were used to evaluate the role of LPPs in controlling PGC positioning. |

Functionality of the lpp MOs (a) Determination of the efficiency of translation-blocking MOs using EGFP reporters. lpp MOs specifically inhibit the translation of the downstream egfp, as demonstrated by the loss of EGFP signal, while the signal persists in co MO-treated embryos. mcherry is used as an unaffected control. N is the number of embryos assayed. (b) Functionality of lpp1 splice-blocking MO using a PCR-based assay with primers presented in Supplementary Table 8. The mRNA level is largely reduced when employing the lpp1 MO, as compared with odc used as control mRNA that is not affected. DNA marker: GeneRuler 1 kb DNA Ladder. |

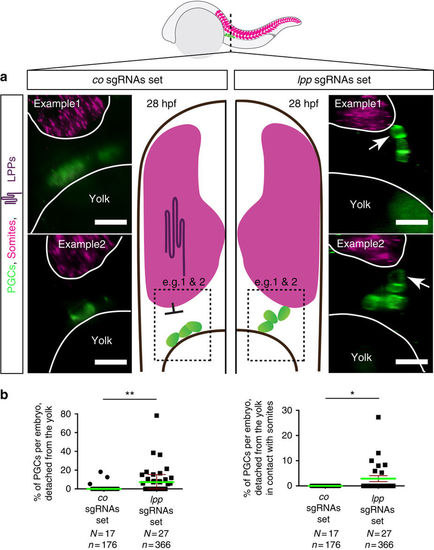
PGCs contact the somites in embryos treated with MOs against lpps (a) PGCs are labeled with EGFP (Tg(kop:egfp-f-3'nos3)) and egfp RNA, both shown in green, with the somites labeled using myoD (shown in magenta) employing the RNAscope procedure. PGCs contact the somites in LPP-knocked down embryos (right, examples 1 and 2), as compared with control embryos, in which PGCs are located at a distance from the somite border and in contact with the yolk (left, examples 1 and 2). (b) The percentage of PGCs per embryo that detached from the yolk (left) as well as those contacted the somites (right) in 28hpf embryos. Green lines represent the median and mean values and error bars indicate median with interquartile range and s.e.m. (left and right respectively). The statistical significance was evaluated using the Mann-Whitney U test (**p ≤ 0.01 and ***p ≤ 0.001). N is the number of embryos and n the number of PGCs examined. Scale bars signify 10μm. Dorsal is up. |
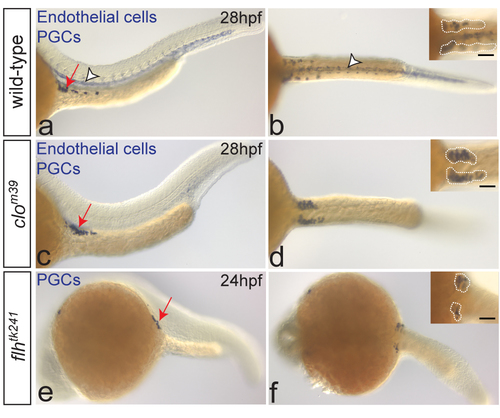
Bilateral positioning of PGC clusters does not require the notochord or blood vessles. One-color in situ hybridization on wild-type (a-b), clom39 (a-d) and flhtk241 (e-f) embryos. PGCs are stained with nos3 (a-f, arrows on the left-panel images) and endothelial cells with kdrl probe (a-d, arrowheads in a-b). Despite the lack of endothelial cells, PGCs arrive at the target (c, arrow) and form two separate clusters at 28hpf (d; dotted lines in inset) in clo mutant embryos (number of embryos examined: N=12), similar to wild-type embryos (a-b; N=60). In embryos lacking notochord (flhtk241), PGCs form two bilateral clusters at the gonad region at 24hpf (e-f; dotted lines in inset; N=15). Scale bars 50μm. Lateral (left panels) and dorsal (right panels) views are shown. |

PGC migration at early developmental stages does not require endoderm. (a, c) Whole-mount in situ hybridization of nos3 as a PGC marker (asterisks) and sox17 as an endodermal marker (blue rim around the yolk in a), both stained in blue. Animal views are shown. (b, d) Hematoxylin and Eosin Counterstained histological sections of embryos following WISH using nos3 (asterisks) and sox17 (blue cells in b) probes. (a-b) Wild-type PGCs migrate in the vicinity of the yolk in close contact with endodermal cells. Number of embryos examined in a: N=20 and b: N=3. (c-d) In sox32 mutant embryos lacking the endoderm PGCs migrate close to the yolk. c: N=20; d: N=10 (e) 3D Confocal Z-stacks of wild-type embryos in the lateral view. Embryos of transgenic fish with EGFP-labeled PGCs are injected with secfp RNA together with an activated taram-A transcript (taram-A*) into one blastomere at 32/ 64-cell stage for endodermal cell labeling, followed by YSL nuclei labeling with h2b-mcherry RNA upon injection into the yolk. PGCs (in green) are positioned among scattered endodermal cells (shown in red) and in the same layer with them, directly above the YSL nuclei (shown in blue) (N=4). Images were processed using Imaris. Scale bars 25μm. Embryos at 70-80% epiboly in all experiments. |
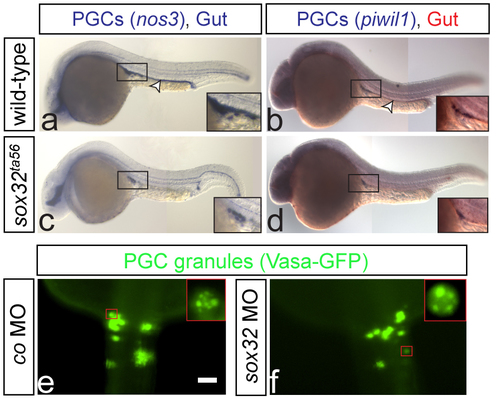
PGCs are normally specified in embryos lacking the gut tube One color (a and c) or two color (b and d) WISH on wild-type and sox32ta56 embryos at 24hpf (a and c respectively) or 28hpf (b and d respectively). The gut is stained using foxa1 probe (a-d). In wild-type and sox32 mutant embryos the PGCs (insets) express both the early marker nos3 and the late marker piwil1. Arrowheads indicate the position of the gut (a-b), and no foxa1 expression is detected in the mutants (c-d). Number of embryos examined in a: N=40, b: N=20, c: N=9 and d: N=5. (e-f) PGCs are labeled with vasa-gfp mRNA, showing the characteristic granule formation in PGCs (insets in e and f respectively). e: N=14 and f: N=15. Scale bar 50μm. Dorsal views are shown. Anterior is up. |

Patterning of the mesodermal tissues adjacent to the gonad is normal in gut-deficient embryos (a-b) Bilateral arrangement of pronephric ducts and the pronephros in embryos deficient for the gut is maintained (pronephric ducts labeled using (Tg(cldnB:egfp)) and pronephros with wt1b probe, green arrows). Anterior is up. (c) Bilateral cxcl12a expression is detected in the somites and lateral plate mesoderm of both control and gut-deficient embryos at 15 and 18hpf. At 24hpf cxcl12a expression at the gonad area is altered in embryos lacking the gut (additional red arrowhead in the cross-section). Green stars indicate cxcl12a expression in the lateral line. The expression of cxcl12a at the gonad region in embryos lacking the gut tube is no longer detected at 28hpf. Scale bars in all panels 50μm. |