
- Title
-
Loss of a Candidate Biliary Atresia Susceptibility Gene, add3a, Causes Biliary Developmental Defects in Zebrafish
- Authors
- Tang, V., Cofer, Z.C., Cui, S., Sapp, V., Loomes, K.M., Matthews, R.P.
- Source
- Full text @ J. Pediatr. Gastroenterol. Nutr.
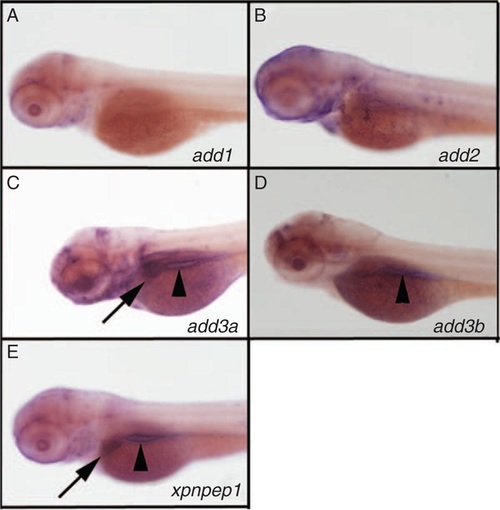
Expression of add3a and xpnpep1 in the developing liver. Whole-mount in situ hybridization (ISH) of 3 days post fertilization (dpf) zebrafish larvae probed for add1 (A), add2 (B), add3a (C), add3b (D), and xpnpep1 (E). There is liver staining for add3a (C, black arrow) and xpnpep1 (E, black arrow) but not for the other probes. There is intestinal staining for add3a, add3b and xpnpep1 (black arrowheads in C, D, E). There is also staining of add2 and add3a in the head region, which is of unclear specificity (B, C). Similar experiments were performed using a riboprobe directed against xpnpep2, but there was no staining in 3 dpf larvae (not shown). |

Decreased biliary function and developmental biliary abnormalities in add3a morpholino-injected 5 days post fertilization (dpf) larvae. Wild-type fertilized oocytes were injected with MO directed against add3a or xpnpep1, or control. At 5 dpf, larvae were incubated in the fluorescent lipid PED6 and assayed for gallbladder uptake, and then fixed and stained for cytokeratin to document biliary anatomy. A, Percentages of control (cont), add3a MO-injected and xpnpep1 MO-injected larvae with normal, faint, or absent gallbladder visibility, reflecting PED6 uptake and thus biliary function. There is a significant decrease in biliary function in the add3a MO-injected larvae (*P ≤ 0.0001 by chi-square analysis), whereas the difference between control and xpnpep1 MO-injected larvae is not significant. B, Confocal projections of cytokeratin immunostainings of livers from 5 dpf larvae injected with control (cont, B), add3a MO (C), or xpnpep1 MO (D). There are 2 examples of each condition (B, B'; C, C'; D, D'), and a schematic outline of each second example (b', c', d'). Note that the pattern of the intrahepatic ducts from the cont and xpnpep1 MO-injected larvae appears similar, whereas the add3a MO-injected larvae have shorter and sparser ducts. Original magnification ×400. MO = morpholino antisense oligonucleotide. PHENOTYPE:
|

Studies of the Hedgehog (Hh) pathway in add3a morpholino-injected larvae. A, Quantitative RT-PCR of Hh pathway targets in control (cont) or add3a MO-injected larvae at 5 days post fertilization (dpf). Note that there is an increase in expression of all 5 genes shown (gli2a, ptch1, foxl1, ccnd1, znf697b), although only gli2a, ptch1, and ccnd1 demonstrate a significant difference (*P ≤ 0.05 by Student t test). B, C, Cyclopamine treatment rescues biliary defects in add3a morpholino-injected larvae. Wild-type fertilized oocytes were injected with MO directed against add3a or control. At 2 dpf, cyclopamine or vehicle was added, and at 5 dpf, larvae were incubated in the fluorescent lipid PED6 and assayed for gallbladder uptake, and then fixed and stained for cytokeratin to document biliary anatomy. B, Percentages of control (cont), and vehicle or cyclopamine-treated add3a MO-injected larvae with normal, faint, or absent gallbladder visibility, reflecting PED6 uptake and thus biliary function. There is a significant decrease in biliary function in the add3a MO-injected larvae (*P ≤ 0.0001 by chi-square testing), which is significantly different from the cyclopamine treated larvae, with the same p-value. C, Confocal projections of cytokeratin immunostainings of livers from 5 dpf larvae injected with control, add3a MO, or add3a MO with cyclopamine. C') Schematic tracings of the cytokeratin stainings shown in (C). Original magnification ×400. MO = morpholino antisense oligonucleotide. |

Epistatic effect of coinjection of add3a and gpc1 morpholinos on biliary function and development. Wild-type fertilized oocytes were injected with MO directed against add3a or gpc1 at lower amounts needed to see an effect, or control. At 5 days post fertilization (dpf), larvae were incubated in the fluorescent lipid PED6 and assayed for gallbladder uptake, and then fixed and stained for cytokeratin to document biliary anatomy. A, Percentages of control (cont), low-dose add3a MO-injected, low-dose gpc1 MO-injected, or add3a and gpc1 MO-injected larvae with normal, faint, or absent gallbladder visibility, reflecting PED6 uptake and thus biliary function. There is a significant decrease in biliary function only in the larvae injected with the lower dose of both MOs (*P ≤ 0.0001 by chi-square analysis). B, Confocal projections of cytokeratin immunostainings of livers from 5 dpf larvae injected with control (cont), low-dose add3a MO, low-dose gpc1 MO, or the combination of both MOs at the lower dose. B’, Schematics of the respective panels shown in (B). Note that the intrahepatic duct pattern is similar in the control and the larvae injected with add3a or gpc1 MO alone, but that when the MOs are injected together the pattern is abnormal, with decreased duct density and complexity. Original magnification ×400. MO = morpholino antisense oligonucleotide. PHENOTYPE:
|

Documentation of morpholino effect. (A-B) Quantitative PCR expression of product with 3' primer in deleted exon, showing markedly decreased expression of add3a (A) and xpnpep1 (B). (C) Gallbladder PED-6 uptake from control, add3a MO-injected, and add3a MO and mRNA-injected larvae, showing statistically significant rescue of the add3a MO phenotype by add3a mRNA injection. (D) Confocal projection of liver cytokeratin staining of mRNA-rescued 5 dpf larva, showing an essentially normal phenotype. *p≤0.0001, chi square test, MO- + mRNA-injected vs. MO-injected. |
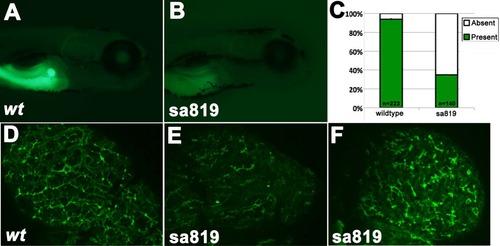
add3a deficiency causes defects in biliary function and morphology. Right lateral views of 5dpf larvae after PED-6 ingestion showing the presence (A) or absence (B) of a gallbladder. (C) Percentages of wildtype siblings and sa819 larvae (*p≤0.0001 by chisquare analysis) with present or absent gallbladder visibility, reflecting PED6 uptake and thus biliary function. (D-F) Confocal projections of cytokeratin immunostainings of livers from (D) wild-type or (E,F) sa819 mutants at 5 dpf. Note that the pattern of the intrahepatic ducts from sa819 mutant larvae appears similar to em>add3a MO-injected larvae from the previous figure. Original magnification 400x. PHENOTYPE:
|

data assertion from publication text, not associated with a figure EXPRESSION / LABELING:
|