- Title
-
Efferocytosis and extrusion of leukocytes determine the progression of early mycobacterial pathogenesis
- Authors
- Hosseini, R., Lamers, G.E., Soltani, H.M., Meijer, A.H., Spaink, H.P., Schaaf, M.J.
- Source
- Full text @ J. Cell Sci.
|
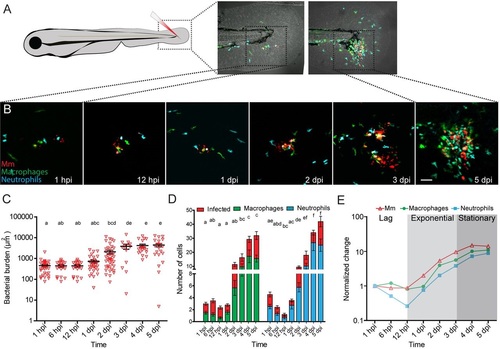
Mm infection in the zebrafish tail fin. (A) Schematic image showing the location in the tail fin where Mm was injected into zebrafish larvae at 3dpf. (B) Representative CLSM images of the infection site in the tail fin at different time points. (C) Quantification of the bacterial burden at different time points after Mm infection. (D) Numbers of macrophages (green) and neutrophils (blue) recruited to the site of infection and their infected fractions (red) per larva. (E) Normalized bacterial burden and numbers of recruited leukocytes (relative to 1hpi). The analysis shows that based on the bacterial burden, the course of infection can be divided into three different phases: the lag, exponential and stationary phase. Error bars indicate s.e.m. (n~20 larvae per time point); means with the same letter do not differ significantly (Dunnett′s post-test, P<0.05). Scale bar: 50µm. EXPRESSION / LABELING:
|
|
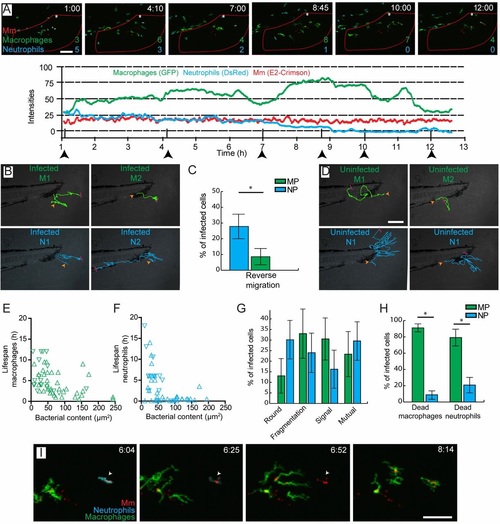
Accumulation of Mm in macrophages occurs through cell death and secondary uptake by macrophages at the site of infection. (A) Intensity profiles for macrophages (green), neutrophils (blue) and Mm (red) at the site of infection in a representative larva, showing dynamic recruitment and resolution of leukocytes. Corresponding images are shown for the time points indicated by the arrowheads, in which the numbers of leukocytes present within the region of interest (red outline) are indicated. (B) Representative trajectories of infected leukocytes. Macrophage 1 (M1) and neutrophil 1 (N1) show short local trajectories in the tail fin. Macrophage 2 (M2) was recruited to the site of infection and remains at the same position after phagocytosis of Mm. Neutrophil 2 (N2) shows reverse migration along the caudal vein. (C) Percentages of leukocytes per larva showing reverse migration. MP, macrophages; NP, neutrophils. (D) Representative trajectories of uninfected macrophages (green) and neutrophils (blue). The macrophages show short trajectories into and out of the tail fin, whereas the neutrophils show longer trajectories in the tail fin before going out. (E,F) Lifespan of infected leukocytes as a function of the infection size at the lag phase of infection. (G) Percentages of infected leukocytes undergoing cell death showing different morphologies. (H) Phagocytosis by macrophages and neutrophils of the bacterial content of leukocytes that have undergone cell death. (I) Representative frames from time-lapse imaging showing phagocytosis by a macrophage of bacterial content, which was initially sequestered inside a neutrophil (arrowhead). In B and D, the orange arrowhead represents the start and the red bar represents the end of the trajectory. Error bars indicate s.e.m. (n~20 larvae per time point). *P<0.05 (Mann-Whitney test). Scale bars: 50µm. EXPRESSION / LABELING:
|
|
Macrophages containing aggregates of Mm undergo burst or extrusion. (A) Representative images from live-cell imaging of a large aggregate of Mm (arrowhead) inside a macrophage undergoing cell death at t=3h. Spreading of Mm was observed at t=5h. The aggregate was compacted again by newly recruited leukocytes at t=8h (see Movie 6). (B) Number of burst events observed at different time points after Mm infection in the tail fin. (C) Number of extrusion events observed at different time points after Mm infection in the tail fin. (D) Representative images from live-cell imaging showing an extrusion event for accumulated Mm in a macrophage (arrowheads). First, the macrophage undergoes cell death and subsequently after 3h the bacterial content is extruded. (E) TEM image of an extruding epithelial cell from the tail fin surrounding a dead cell containing a large aggregate of Mm. The two epithelial layers and actinotrichia are indicated. (F) Higher magnification of the region indicated in E, showing compact aggregates of Mm (asterisks) in the dead cell with a condensed nucleus (arrowhead). Error bars indicate s.e.m. (n~20 larvae per time point), means with the same letter do not differ significantly (Dunnett′s post-test, P<0.05). Scale bars: 10µm (A,D,E); 2µm (F). EXPRESSION / LABELING:
|
|
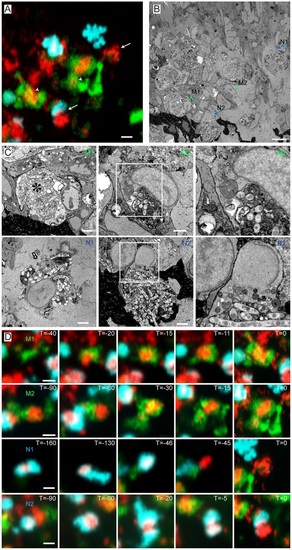
Ultrastructure of correlated macrophages and neutrophils in 3D serial block-face SEM images. (A) High-resolution CLSM image of an infected tail fin after live-cell imaging and fixation. (B) SBFSEM image of the same region as in A showing correlated macrophages (arrowheads) and neutrophils (arrows). (C) Higher magnification SBFSEM images of the two macrophages and two neutrophils indicated in A and B. (D) Frames from time-lapse imaging showing the macrophages and neutrophils in C at previous time points. The macrophage (M1) with a fragmented nucleus contains a high Mm content, indicated by the asterisk in C. This macrophage phagocytized the bacterial content ~30min before fixation. Macrophage M2 contains a large aggregate of Mm which was phagocytized Mm ~1.5h before fixation. Neutrophil N1 shows a rapid signal disappearance ~45min before the fixation (D). Neutrophil N2 was recruited to the bacterial aggregate ~30min before fixation (D). Scale bars: 10µm (A-C); 2µm (D). EXPRESSION / LABELING:
|
|
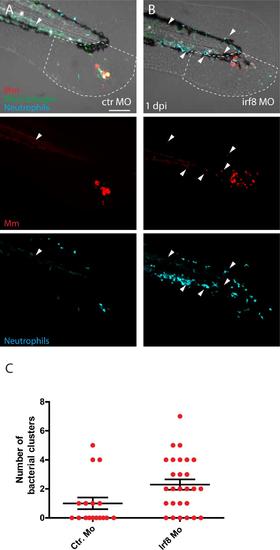
Increase of neutrophil numbers at the expense of macrophages leads to more Mm distal dissemination events. A and B) Representative images of Mm (red) infected transgenic larvae showing macrophages (green) and neutrophils (blue) at 1 dpi in control group (A) and in irf8 morphants (B). Arrowheads indicates the bacterial clusters observed at a distal area from the site of injection (outside the ROI, indicated by white dashed line) C) Number of bacterial clusters observed in the control group and irf8 morphants outside the ROI. Error bars indicate SEM (n~20 larvae per time point), * indicate P<0.05 (Mann-Whitney test). Scale bar: 100 µm. |
|
Different cell death morphologies of Mm infected macrophages and neutrophils. A and B) Selected frames taken from the image sequences of a macrophage (A) and a neutrophil (B) showing fragmentation of the cell in several compartment. C and D) Selected frames taken from the image sequences of a macrophage (C) and a neutrophil (D) showing rapid disappearance of the fluorescent signal. E and F) Selected frames taken from the image sequences of a macrophage (E) and a neutrophil (F) showing rounding up of the cell. Scale bars: A-B 200 µm, C-H 10 µm. |
|
Secondary granulomas at late stages of infection. A) Representative image of an infected tail fin showing a secondary granuloma like aggregate (arrow) near the caudal vein. B) Percentage of larvae showing formation of a secondary granuloma like aggregate at different stages of infection. Scale bar: 100 µm. |
|
Correlation of the CLSM and 3D block-face SEM images. A) Alignment of Mm volumes imaged by CLSM and BF-SEM. The Mm in BF-SEM images were segmented and the 3D rendered surface of this segmentation is shown in green. The 3D rendered surface of the fluorescent signal obtained using CLSM is shown in yellow. B) Surface rendering of the macrophage (green) and neutrophil (blue) fluorescent signal was used after alignment to localize the macrophages and neutrophils in BF-SEM images. C-F) Aligned BF-SEM images projected in the 3D CLSM images shown from different angles. G) Orthogonal slices of BF-SEM images showing extrusion of a Mm aggregate from the outer epithelial layer. |


