
Fig. 1
- ID
- ZDB-FIG-161017-1
- Publication
- Hosseini et al., 2016 - Efferocytosis and extrusion of leukocytes determine the progression of early mycobacterial pathogenesis
- Other Figures
- All Figure Page
- Back to All Figure Page
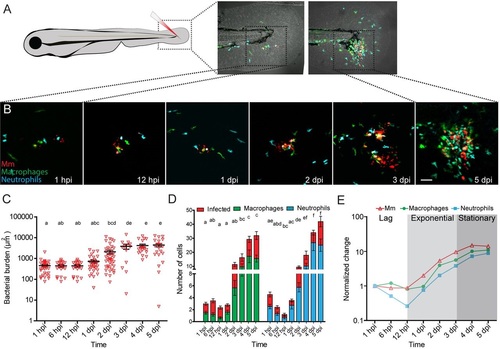
Mm infection in the zebrafish tail fin. (A) Schematic image showing the location in the tail fin where Mm was injected into zebrafish larvae at 3dpf. (B) Representative CLSM images of the infection site in the tail fin at different time points. (C) Quantification of the bacterial burden at different time points after Mm infection. (D) Numbers of macrophages (green) and neutrophils (blue) recruited to the site of infection and their infected fractions (red) per larva. (E) Normalized bacterial burden and numbers of recruited leukocytes (relative to 1hpi). The analysis shows that based on the bacterial burden, the course of infection can be divided into three different phases: the lag, exponential and stationary phase. Error bars indicate s.e.m. (n~20 larvae per time point); means with the same letter do not differ significantly (Dunnett′s post-test, P<0.05). Scale bar: 50µm. |
| Genes: | |
|---|---|
| Fish: | |
| Condition: | |
| Anatomical Terms: | |
| Stage Range: | Protruding-mouth to Day 5 |