Fig. 2
- ID
- ZDB-FIG-161017-2
- Publication
- Hosseini et al., 2016 - Efferocytosis and extrusion of leukocytes determine the progression of early mycobacterial pathogenesis
- Other Figures
- All Figure Page
- Back to All Figure Page
|
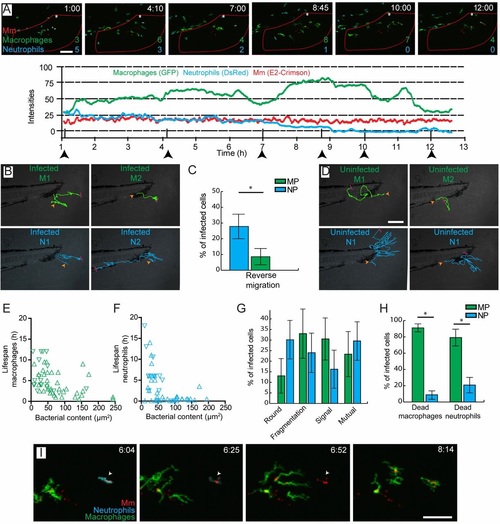
Accumulation of Mm in macrophages occurs through cell death and secondary uptake by macrophages at the site of infection. (A) Intensity profiles for macrophages (green), neutrophils (blue) and Mm (red) at the site of infection in a representative larva, showing dynamic recruitment and resolution of leukocytes. Corresponding images are shown for the time points indicated by the arrowheads, in which the numbers of leukocytes present within the region of interest (red outline) are indicated. (B) Representative trajectories of infected leukocytes. Macrophage 1 (M1) and neutrophil 1 (N1) show short local trajectories in the tail fin. Macrophage 2 (M2) was recruited to the site of infection and remains at the same position after phagocytosis of Mm. Neutrophil 2 (N2) shows reverse migration along the caudal vein. (C) Percentages of leukocytes per larva showing reverse migration. MP, macrophages; NP, neutrophils. (D) Representative trajectories of uninfected macrophages (green) and neutrophils (blue). The macrophages show short trajectories into and out of the tail fin, whereas the neutrophils show longer trajectories in the tail fin before going out. (E,F) Lifespan of infected leukocytes as a function of the infection size at the lag phase of infection. (G) Percentages of infected leukocytes undergoing cell death showing different morphologies. (H) Phagocytosis by macrophages and neutrophils of the bacterial content of leukocytes that have undergone cell death. (I) Representative frames from time-lapse imaging showing phagocytosis by a macrophage of bacterial content, which was initially sequestered inside a neutrophil (arrowhead). In B and D, the orange arrowhead represents the start and the red bar represents the end of the trajectory. Error bars indicate s.e.m. (n~20 larvae per time point). *P<0.05 (Mann-Whitney test). Scale bars: 50µm. |
| Genes: | |
|---|---|
| Fish: | |
| Condition: | |
| Anatomical Terms: | |
| Stage: | Protruding-mouth |

