
Fig. S1
- ID
- ZDB-IMAGE-161017-5
- Publication
- Hosseini et al., 2016 - Efferocytosis and extrusion of leukocytes determine the progression of early mycobacterial pathogenesis
- All Figures
- Figures for Hosseini et al., 2016
|
Fig. S1
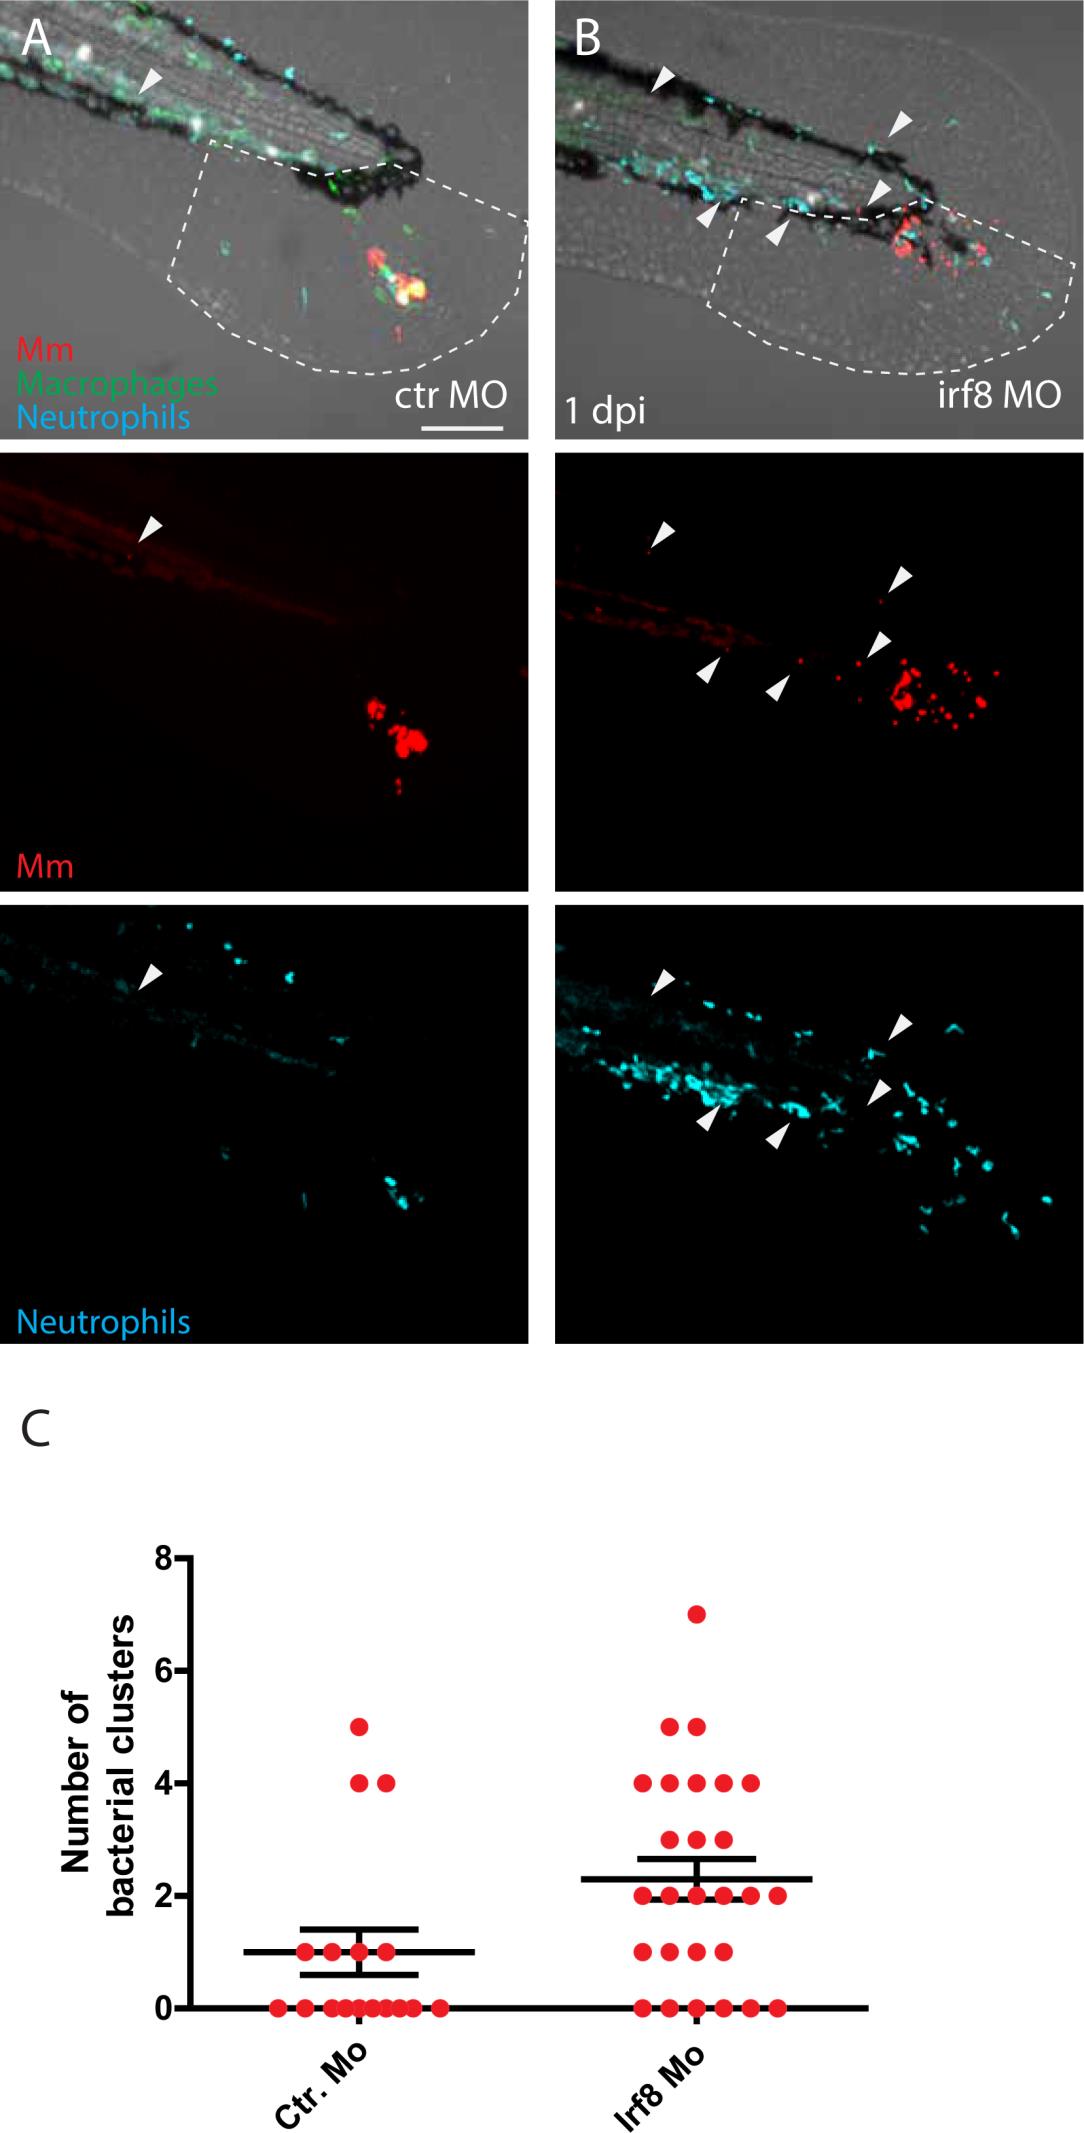
Increase of neutrophil numbers at the expense of macrophages leads to more Mm distal dissemination events. A and B) Representative images of Mm (red) infected transgenic larvae showing macrophages (green) and neutrophils (blue) at 1 dpi in control group (A) and in irf8 morphants (B). Arrowheads indicates the bacterial clusters observed at a distal area from the site of injection (outside the ROI, indicated by white dashed line) C) Number of bacterial clusters observed in the control group and irf8 morphants outside the ROI. Error bars indicate SEM (n~20 larvae per time point), * indicate P<0.05 (Mann-Whitney test). Scale bar: 100 µm.