
- Title
-
Establishment of a drug evaluation model against light-induced retinal degeneration using adult pigmented zebrafish
- Authors
- Saito, Y., Tsuruma, K., Shimazawa, M., Nishimura, Y., Tanaka, T., Hara, H.
- Source
- Full text @ J. Pharmacol. Sci.
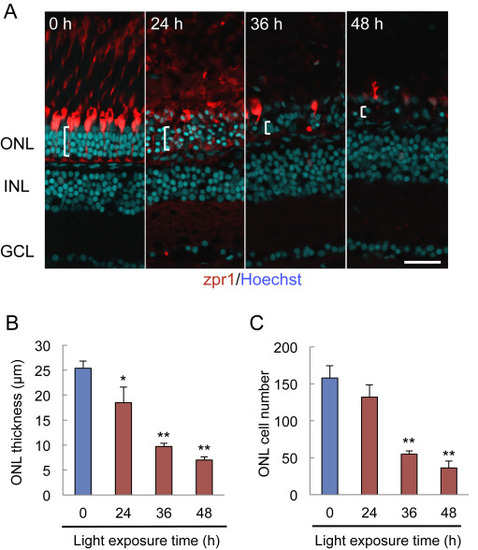
Retinal degeneration induced by light irradiation shows time dependency. (A) Typical images immunostained for zpr1 (red) and Hoechst 33342 (blue). (B-C) Quantification of ONL thickness and ONL cell number using immunostaining. Data are shown as means ± SEM (n = 5-8). **p < 0.01 and *p < 0.05 vs. 0 h (Student′s t-test). Scale bar = 30 µm. GCL, ganglion cell layer; INL, inner nuclear layer; ONL, outer nuclear layer; OS, outer segment. |
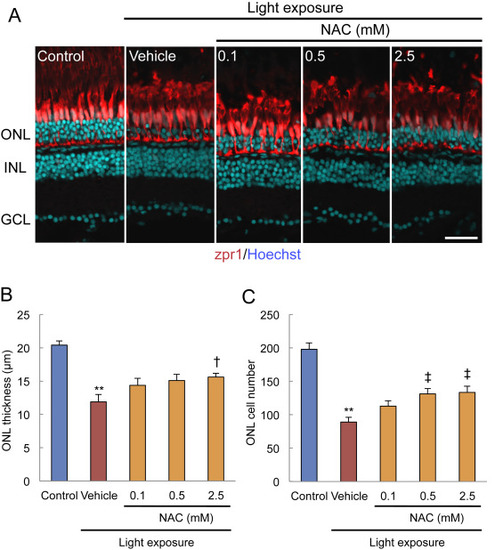
Intravitreal administration of NAC protects against light-induced retinal degeneration in a concentration-dependent manner. (A) Typical images immunostained for zpr1 (red) and Hoechst 33342 (blue). (B-C) Quantification of ONL thickness and ONL cell number using the immunostaining results. Data are shown as means ± SEM (n = 4-6). **p < 0.01 and *p < 0.05 vs. control (Student′s t-test). ‡p < 0.01 and †p < 0.05 vs. vehicle (Dunnett test). Scale bar = 30 µm. GCL, ganglion cell layer; INL, inner nuclear layer; NAC, N-acetylcysteine; ONL, outer nuclear layer. |
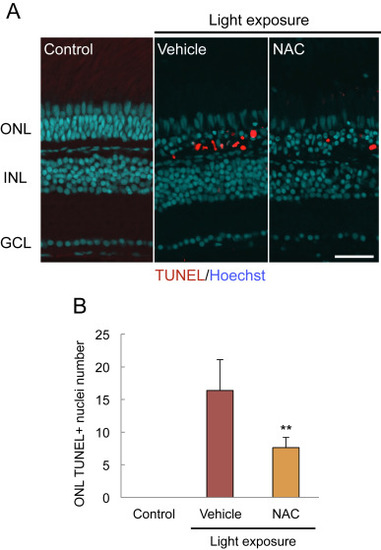
Intravitreal administration of NAC diminishes light-induced increases in TUNEL-positive ONL cells. (A) Typical images showing TUNEL-positive (red) and DNA (Hoechst 33342, blue) stained cells. (B) Quantification of the TUNEL-positive nuclei number. Data are shown as means ± SEM (n = 7 or 8). *p < 0.05 vs. vehicle (Student′s t-test). Scale bar = 30 µm. GCL, ganglion cell layer; INL, inner nuclear layer; NAC, N-acetylcysteine; ONL, outer nuclear layer. PHENOTYPE:
|

Optical coherence tomography (OCT) imaging of light damaged retina. (A) OCT image of a retina without light irradiation at 24 h. (B) Quantification of retinal thickness using OCT imaging results. For OCT imaging, fish were anesthetized for five minutes prior to imaging with 0.1% phenoxyethanol solution for about 1 min. Fish were laid with their right eye to the top and wrapped with a soft paper soaked with 0.1% phenoxyethanol (with the exception of the head). Before imaging, the pupils were dilated with 0.5% tropicamide (Santen, Osaka, Japan) and the eyes were lubricated with hydroxyethyl cellulose (Senju, Osaka, Japan). Retinal fundus images were taken during the same session as corresponding OCT scans using the MicronIV fundus camera (Phoenix Research Labs, Pleasanton, CA, USA). Data are shown as means ±SEM (n = 4). **p < 0.01 (Student’s t-test). Scale bars = 30 µm. INL, inner nuclear layer; ONL, outer nuclear layer; OS, outer segment. |